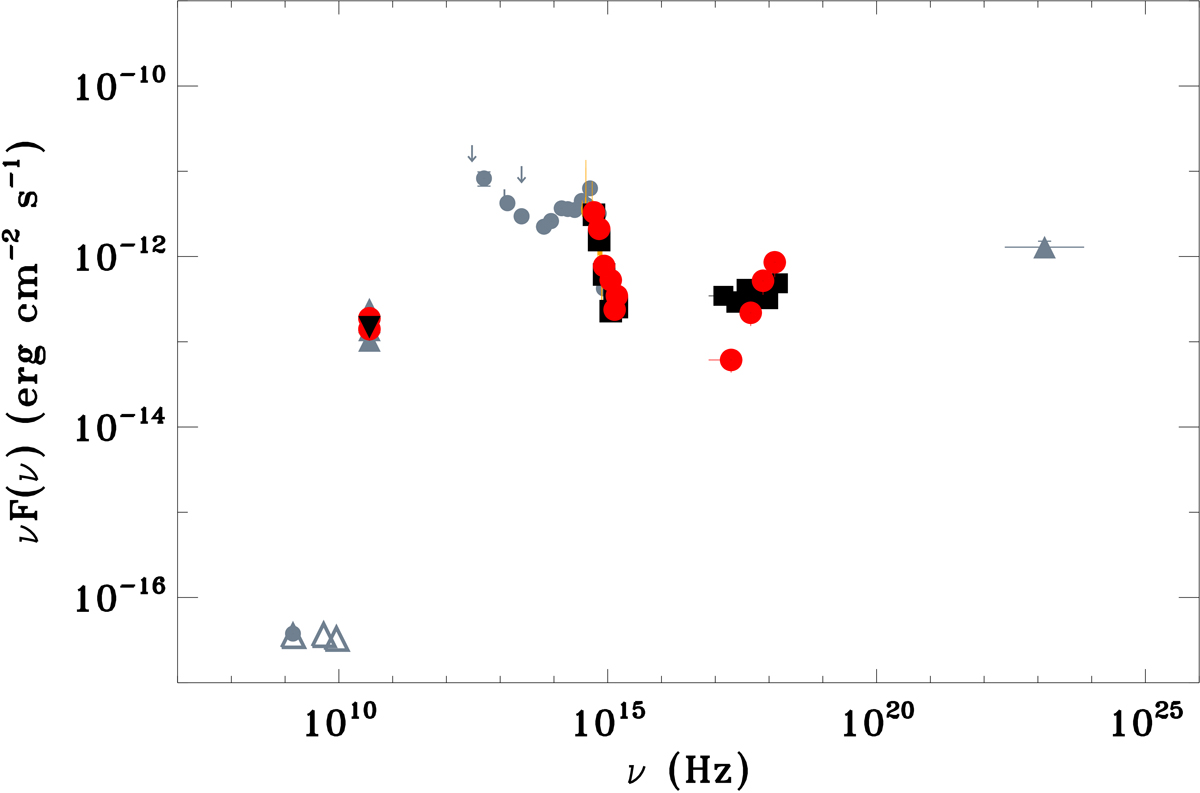
Fig. 3.
Download original image
Spectral energy distribution of SDSS J164100.10+345452.7. The black filled square points represent the Swift data obtained during the two-year Swift campaigns; the black filled triangle is a representative Metsähovi upper limit (0.40 Jy) calculated as an average over 15 d, while the red filled circles are the strictly simultaneous ones obtained during the flare of May 2020 (Swift and Metsähovi). The SDSS spectrum is shown in orange. The grey points are drawn from the literature: JVLA 1.6, 5.2, and 9 GHz data (empty triangles), Metsähovi 37 GHz data (filled triangles), and Fermi (filled triangles), as well as FIRST, IRAS, WISE, USNO, 2MASS, SDSS, and WGA catalogues points collected from the ASI/SSDC SED Builder Tool.
Current usage metrics show cumulative count of Article Views (full-text article views including HTML views, PDF and ePub downloads, according to the available data) and Abstracts Views on Vision4Press platform.
Data correspond to usage on the plateform after 2015. The current usage metrics is available 48-96 hours after online publication and is updated daily on week days.
Initial download of the metrics may take a while.