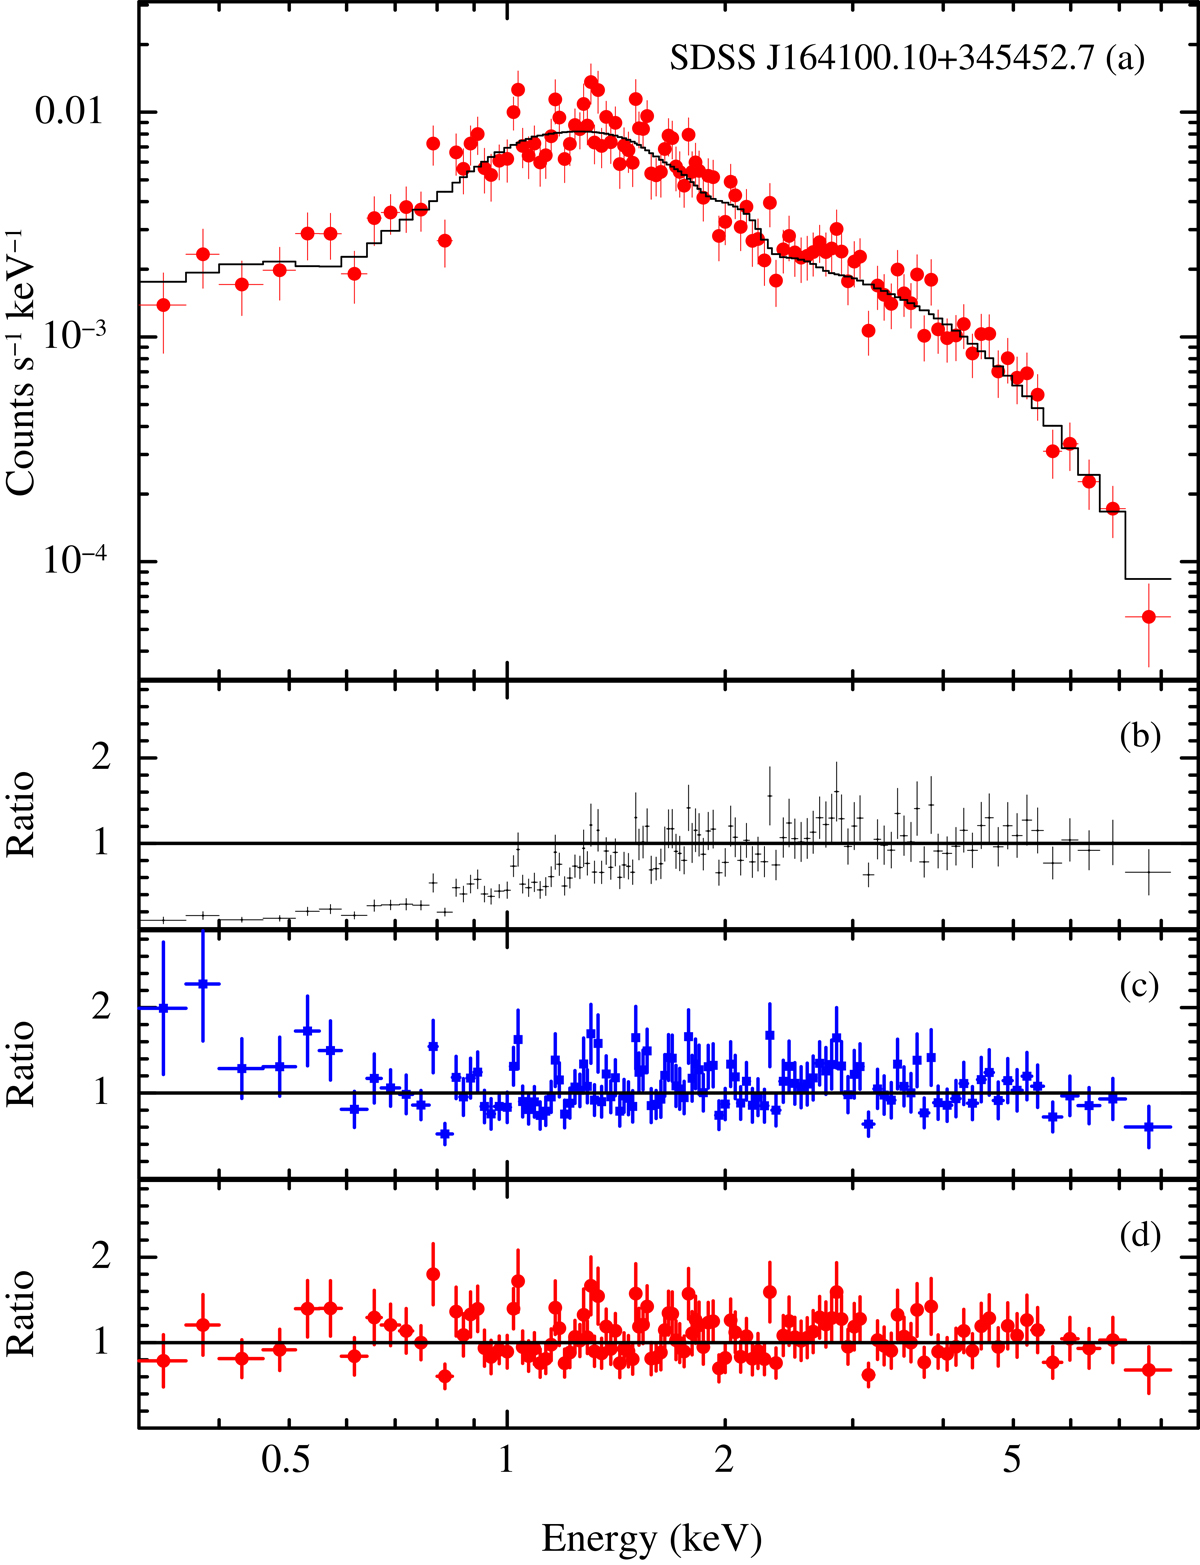
Fig. 2.
Download original image
Swift/XRT average spectrum of SDSS J164100.10+345452.7. The data are drawn from the whole two-year observing campaign (details on the spectral fits can be found in Table 3). Panel a: best fit obtained by adopting the model TBABS * ZPCFABS * ZPOWERLW; panel b: data/model ratio from the fit with TBABS * ZPOWERLW in the 2–10 keV band; panel c: data/model ratio from the fit with TBABS * ZTBABS * ZPOWERLW (0.3–10 keV); and panel d: data/model ratio from the fit with TBABS * ZPCFABS * ZPOWERLW (0.3–10 keV).
Current usage metrics show cumulative count of Article Views (full-text article views including HTML views, PDF and ePub downloads, according to the available data) and Abstracts Views on Vision4Press platform.
Data correspond to usage on the plateform after 2015. The current usage metrics is available 48-96 hours after online publication and is updated daily on week days.
Initial download of the metrics may take a while.