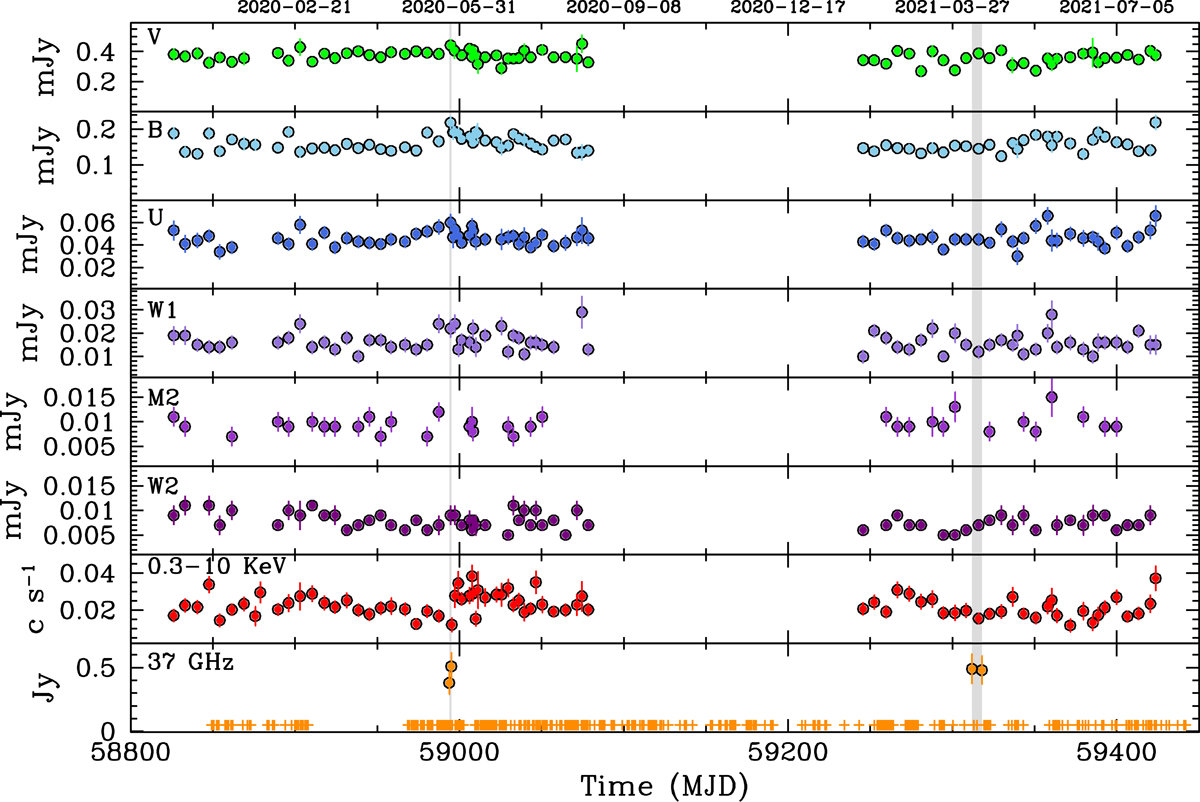
Fig. 1.
Download original image
Multi-wavelength light curves of SDSS J164100.10+345452.7. The optical, UV, and X-ray light curves were collected by Swift from 2019-12-09 to 2020-08-17 (first year campaign), from 2021-01-31 to 2021-07-28 (second year), which are shown with 1σ errorbars. The data at 37 GHz were collected at Metsähovi (< 4σ non-detections represented by crosses). Grey bands mark the Metsähovi detections. Top axis reports representative dates during the campaigns.
Current usage metrics show cumulative count of Article Views (full-text article views including HTML views, PDF and ePub downloads, according to the available data) and Abstracts Views on Vision4Press platform.
Data correspond to usage on the plateform after 2015. The current usage metrics is available 48-96 hours after online publication and is updated daily on week days.
Initial download of the metrics may take a while.