Fig. 6.

Download original image
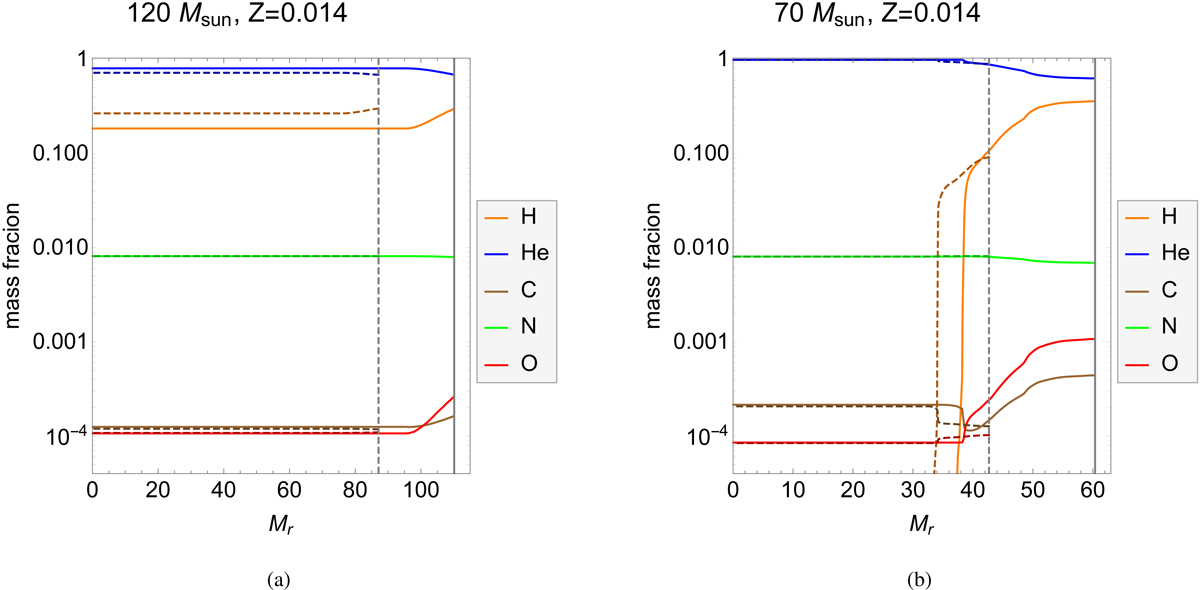
Variation on the logarithmic scale of the mass fraction of hydrogen, helium, and CNO elements as a function of the Lagrangian mass coordinate in solar units in the (a) 120 M⊙ model and (b) the 70 M⊙ model for the two prescriptions of the mass losses studied in the present work at the end of the main-sequence stage. The meaning of the different line styles is the same as in Fig. 3. Vertical grey lines represent the total mass of both models, which correspond to the final masses at the end of MS tabulated in Table 3.
Current usage metrics show cumulative count of Article Views (full-text article views including HTML views, PDF and ePub downloads, according to the available data) and Abstracts Views on Vision4Press platform.
Data correspond to usage on the plateform after 2015. The current usage metrics is available 48-96 hours after online publication and is updated daily on week days.
Initial download of the metrics may take a while.


