Fig. 13.
Download original image
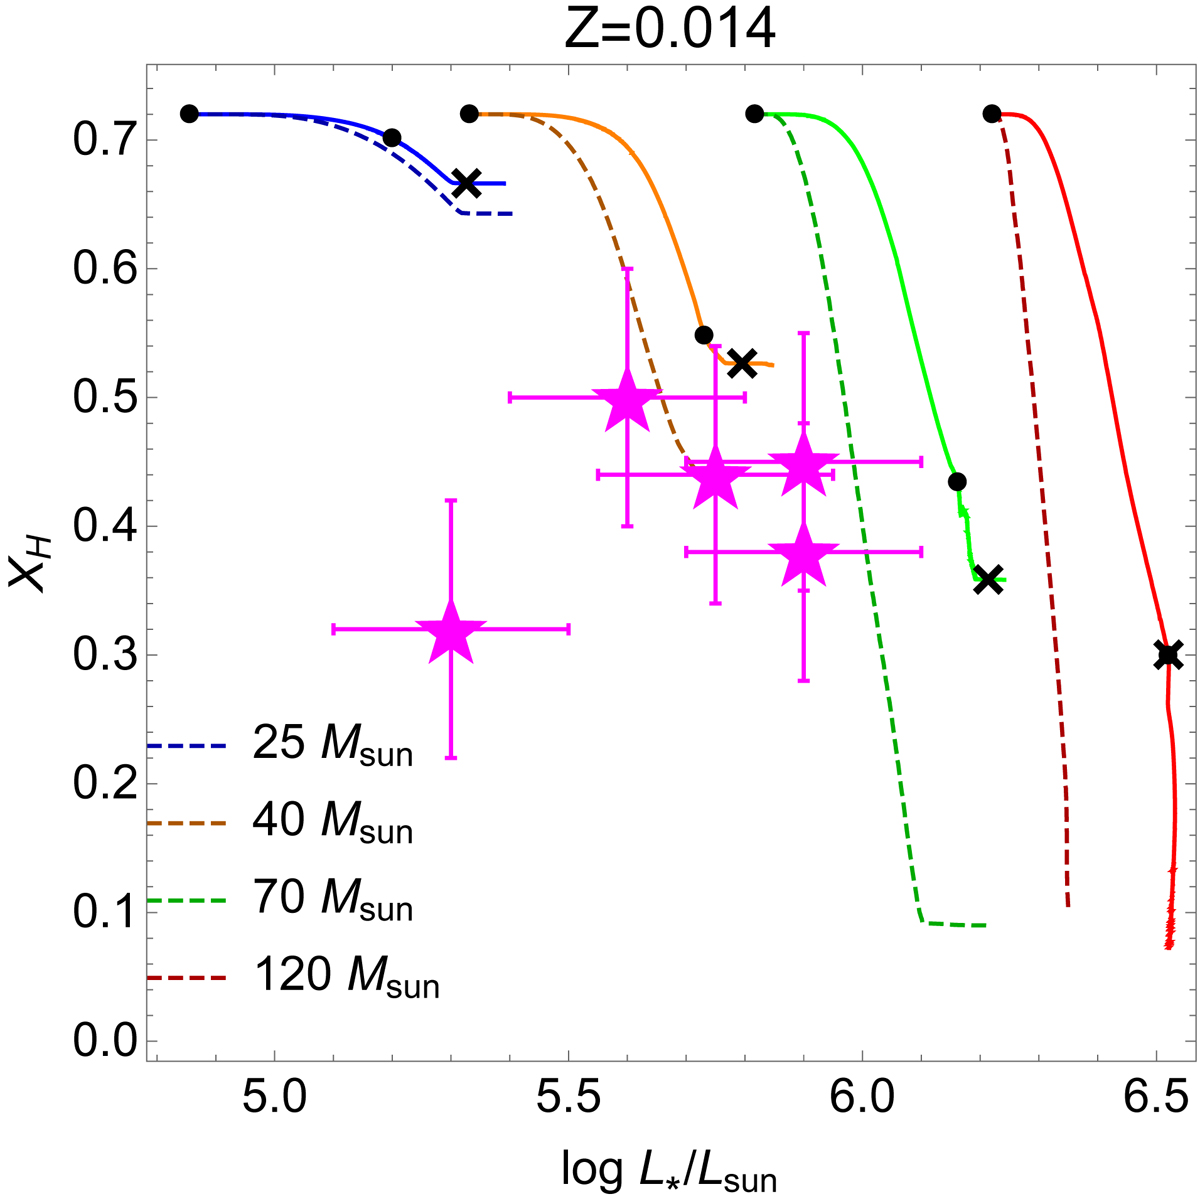
Surface hydrogen abundance (in mass fraction) as a function of the stellar luminosity for different evolutionary tracks. Continuous lines are models computed with the self-consistent mass-loss rate, and dashed lines are computed with Vink’s original recipe. Magenta symbols are the Ofpe stars from the Galactic centre as plotted by Martins et al. (2007, compare with their Fig. 21).
Current usage metrics show cumulative count of Article Views (full-text article views including HTML views, PDF and ePub downloads, according to the available data) and Abstracts Views on Vision4Press platform.
Data correspond to usage on the plateform after 2015. The current usage metrics is available 48-96 hours after online publication and is updated daily on week days.
Initial download of the metrics may take a while.