Open Access
Fig. 12.
Download original image
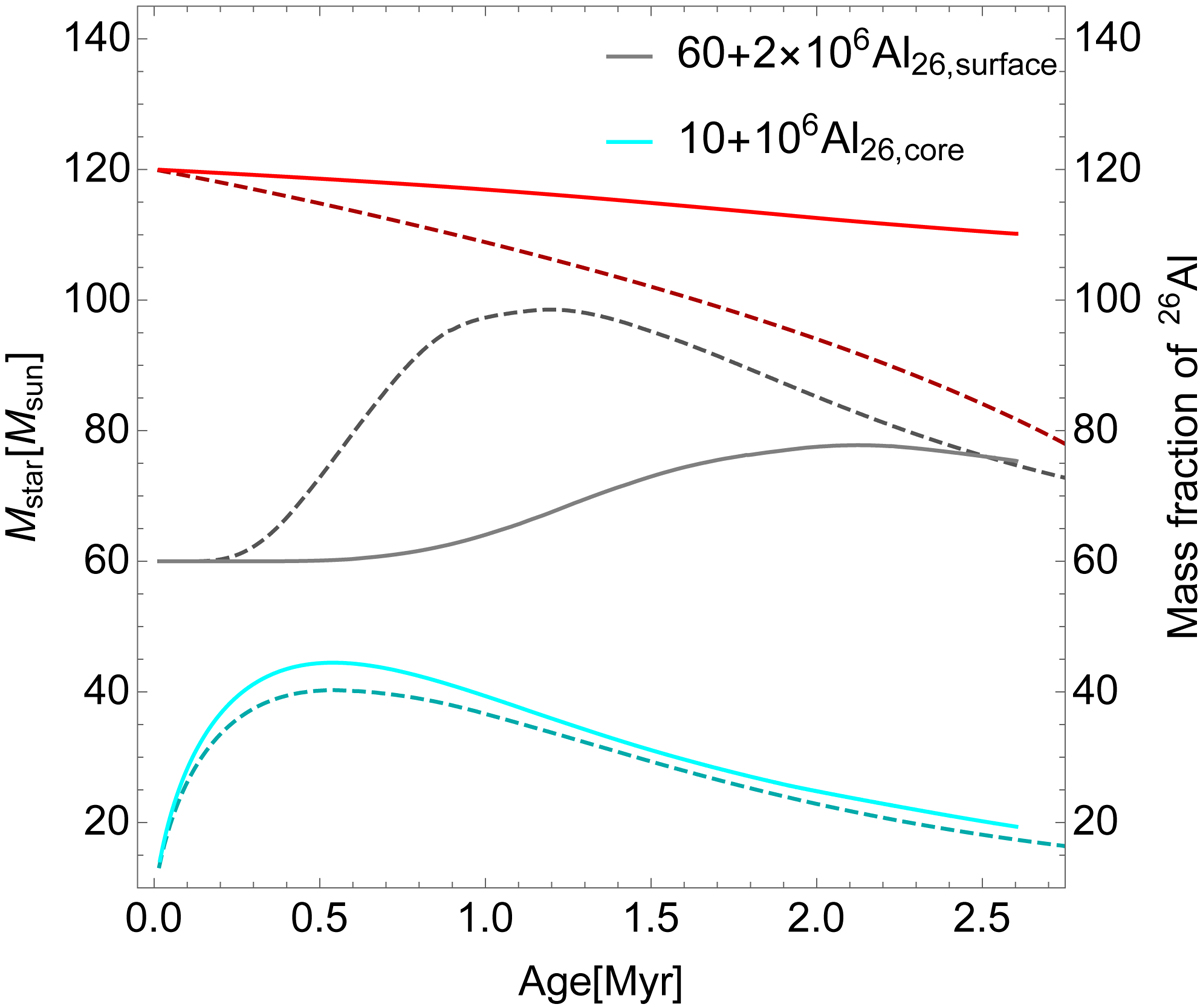
Variation as a function of time of the total mass (upper red curves), of the mass fraction of 26Al at the centre (bottom cyan curves), and at the surface (grey curves beginning at an ordinate equal to 60) in the 120 M⊙ rotating models with the old (upper panel) and new (lower panel) mass-loss rates.
Current usage metrics show cumulative count of Article Views (full-text article views including HTML views, PDF and ePub downloads, according to the available data) and Abstracts Views on Vision4Press platform.
Data correspond to usage on the plateform after 2015. The current usage metrics is available 48-96 hours after online publication and is updated daily on week days.
Initial download of the metrics may take a while.