Open Access
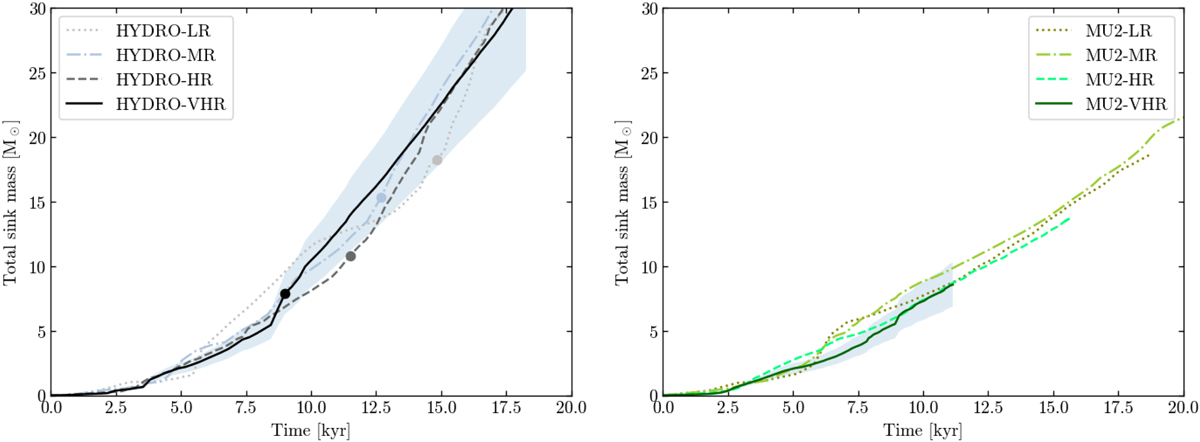
Fig. 6.
Download original image
Sums of all sink masses as a function of time. Left panel: sums of all sink masses in the HYDRO runs. The filled circles indicate the secondary formation epoch. Right panel: sums of all sink masses in the MU2 runs. In both panels, the blue region shows the value obtained in the highest resolution runs ±20%.
Current usage metrics show cumulative count of Article Views (full-text article views including HTML views, PDF and ePub downloads, according to the available data) and Abstracts Views on Vision4Press platform.
Data correspond to usage on the plateform after 2015. The current usage metrics is available 48-96 hours after online publication and is updated daily on week days.
Initial download of the metrics may take a while.