Fig. 1.
Download original image
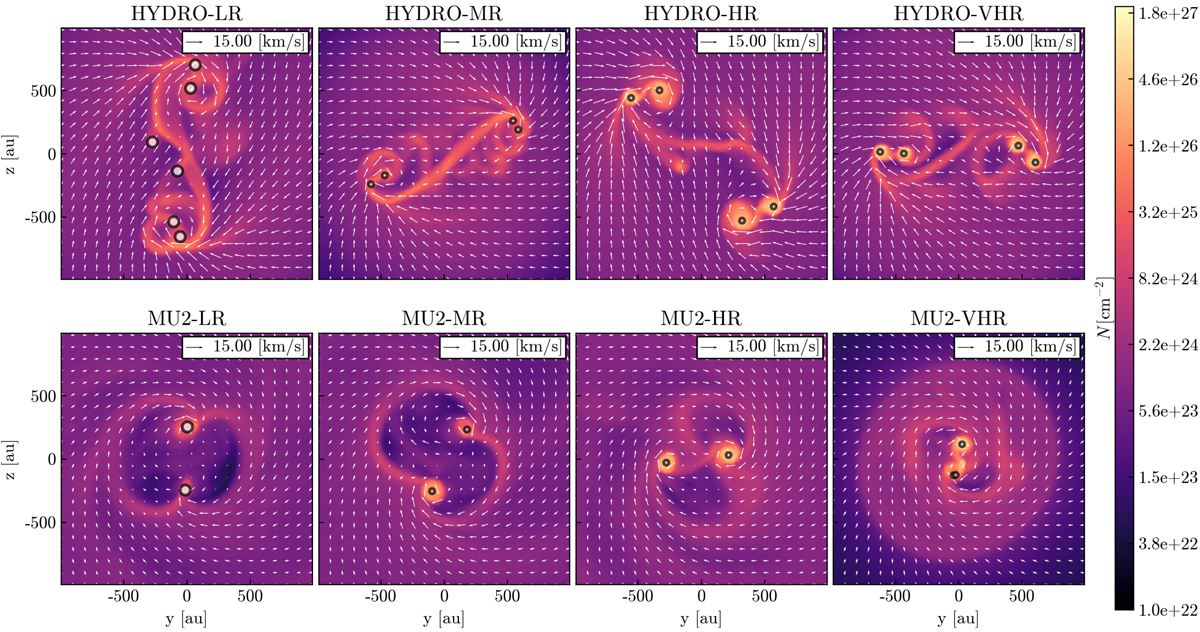
Column density in the HYDRO runs (top row) and in the magnetic runs (bottom row) at low resolution (far-left panels), mid resolution (center left), high resolution (center right), and very-high resolution (far right panels). The column density is computed over 200 AU along the x-axis (the rotation axis) and is displayed in the x = 0 plane at the end of the runs. White dots indicate sink particle positions. Gas velocity vectors are overplotted.
Current usage metrics show cumulative count of Article Views (full-text article views including HTML views, PDF and ePub downloads, according to the available data) and Abstracts Views on Vision4Press platform.
Data correspond to usage on the plateform after 2015. The current usage metrics is available 48-96 hours after online publication and is updated daily on week days.
Initial download of the metrics may take a while.