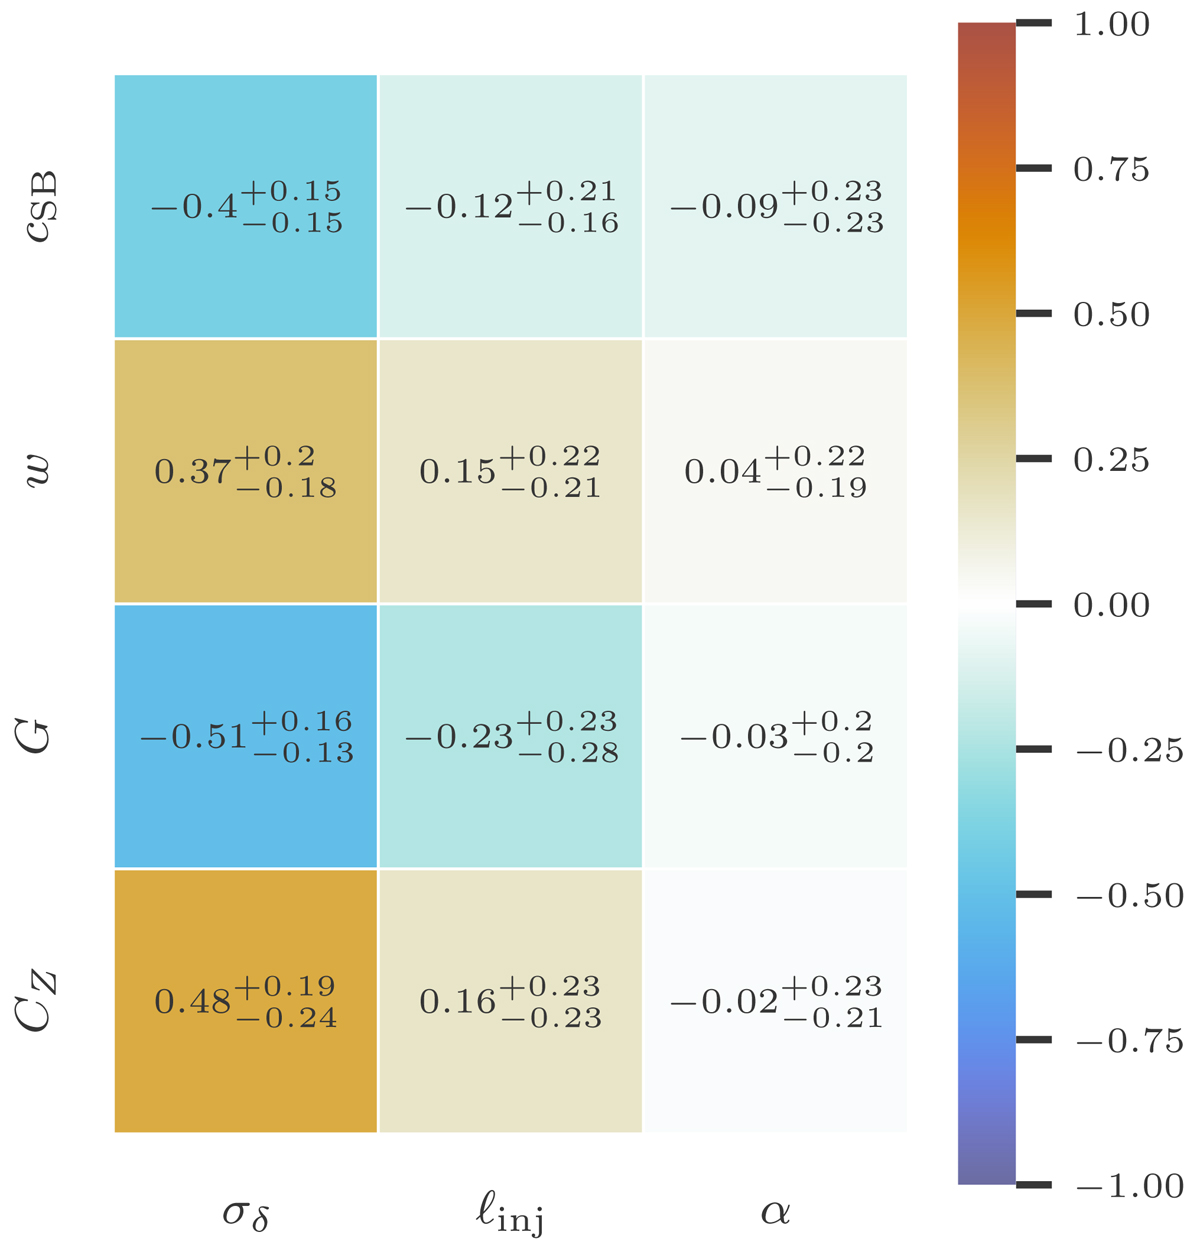
Fig. 7.
Download original image
Correlation matrix as measured by the Spearman coefficient between the morphological indicators and the density fluctuation power spectrum parameters. We display the median and difference with the 16th–84th percentiles. The morphological parameters are defined in Sect. 4.1 and the density fluctuation parameters are defined in Eq. (13) and evaluated inside R500 for each cluster in the X-COP sample.
Current usage metrics show cumulative count of Article Views (full-text article views including HTML views, PDF and ePub downloads, according to the available data) and Abstracts Views on Vision4Press platform.
Data correspond to usage on the plateform after 2015. The current usage metrics is available 48-96 hours after online publication and is updated daily on week days.
Initial download of the metrics may take a while.