Fig. 6.
Download original image
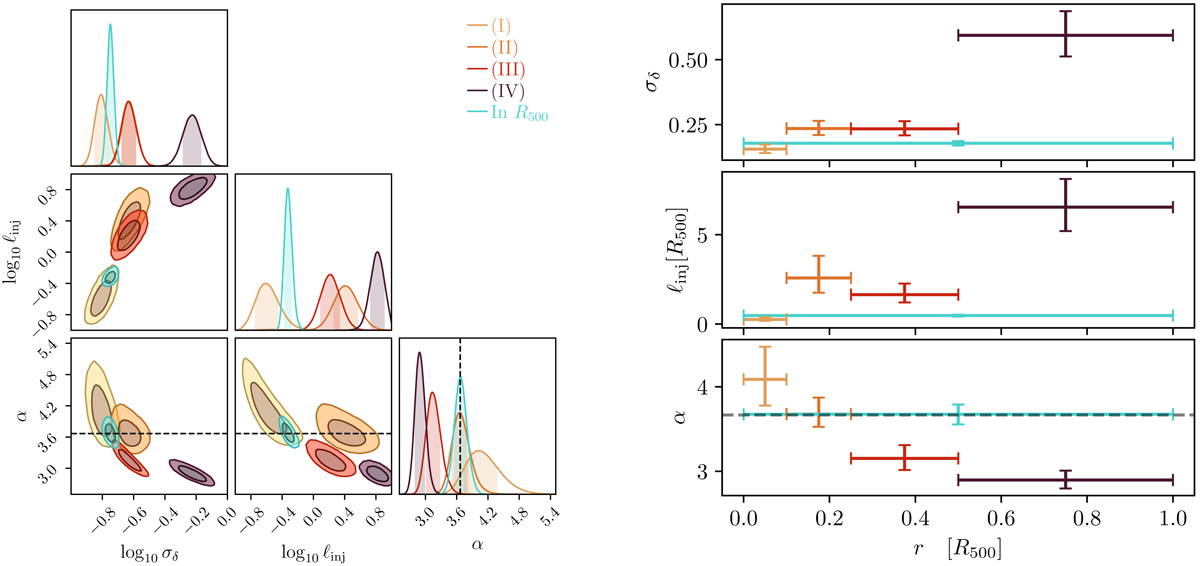
Posterior distributions (left) and radial evolution (right) of the standard deviation, σδ, the injection scale, ℓinj, and the spectral index α of the density fluctuation power spectrum parameters, jointly evaluated on the whole X-COP cluster sample in the four regions as defined in Table (1) and within R500. The colour scale matches the four regions of interest, and the turquoise distribution represents the entire R500 region. The black dashed line represents the expected 11/3 index from Kolmogorov-Oboukhov theory.
Current usage metrics show cumulative count of Article Views (full-text article views including HTML views, PDF and ePub downloads, according to the available data) and Abstracts Views on Vision4Press platform.
Data correspond to usage on the plateform after 2015. The current usage metrics is available 48-96 hours after online publication and is updated daily on week days.
Initial download of the metrics may take a while.