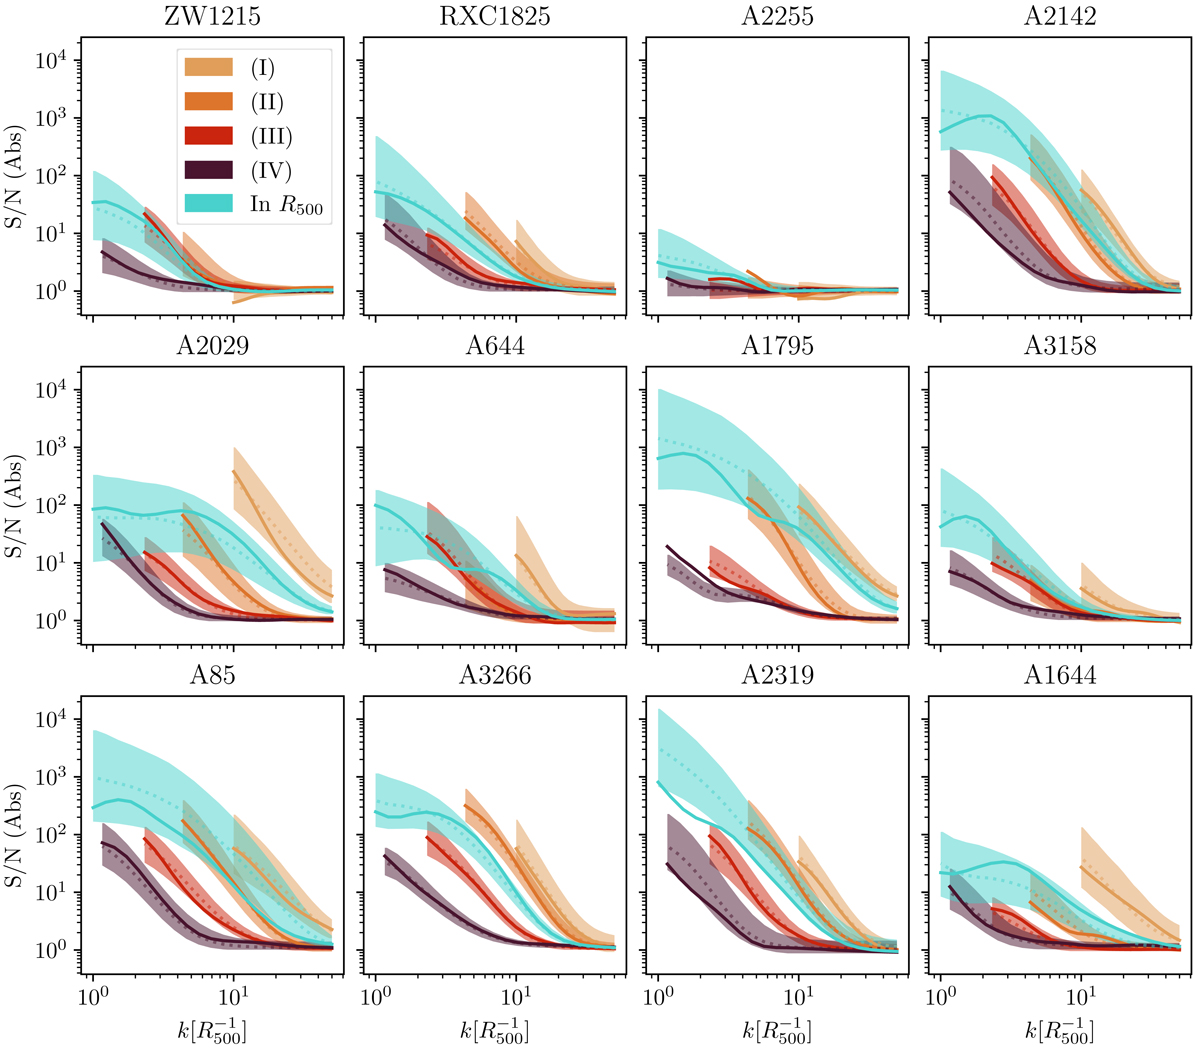
Fig. 5.
Download original image
Power spectrum S/N as defined in Eq. (14) and measured on the surface brightness fluctuation maps with the absolute method (see Sect. 2.6) in the four regions as defined in Table (1) and inside R500 for each cluster in the X-COP sample. Dotted line and shaded envelopes show the posterior distribution median and 16th–84th percentiles, accounting for the complete error budget for each cluster. The plain line represents the measured observable for each cluster in X-COP. The plots are ranked in ascending order of disturbance for the cluster, as measured by the CZ coefficient (see Sect. 4.1).
Current usage metrics show cumulative count of Article Views (full-text article views including HTML views, PDF and ePub downloads, according to the available data) and Abstracts Views on Vision4Press platform.
Data correspond to usage on the plateform after 2015. The current usage metrics is available 48-96 hours after online publication and is updated daily on week days.
Initial download of the metrics may take a while.