Fig. 4.
Download original image
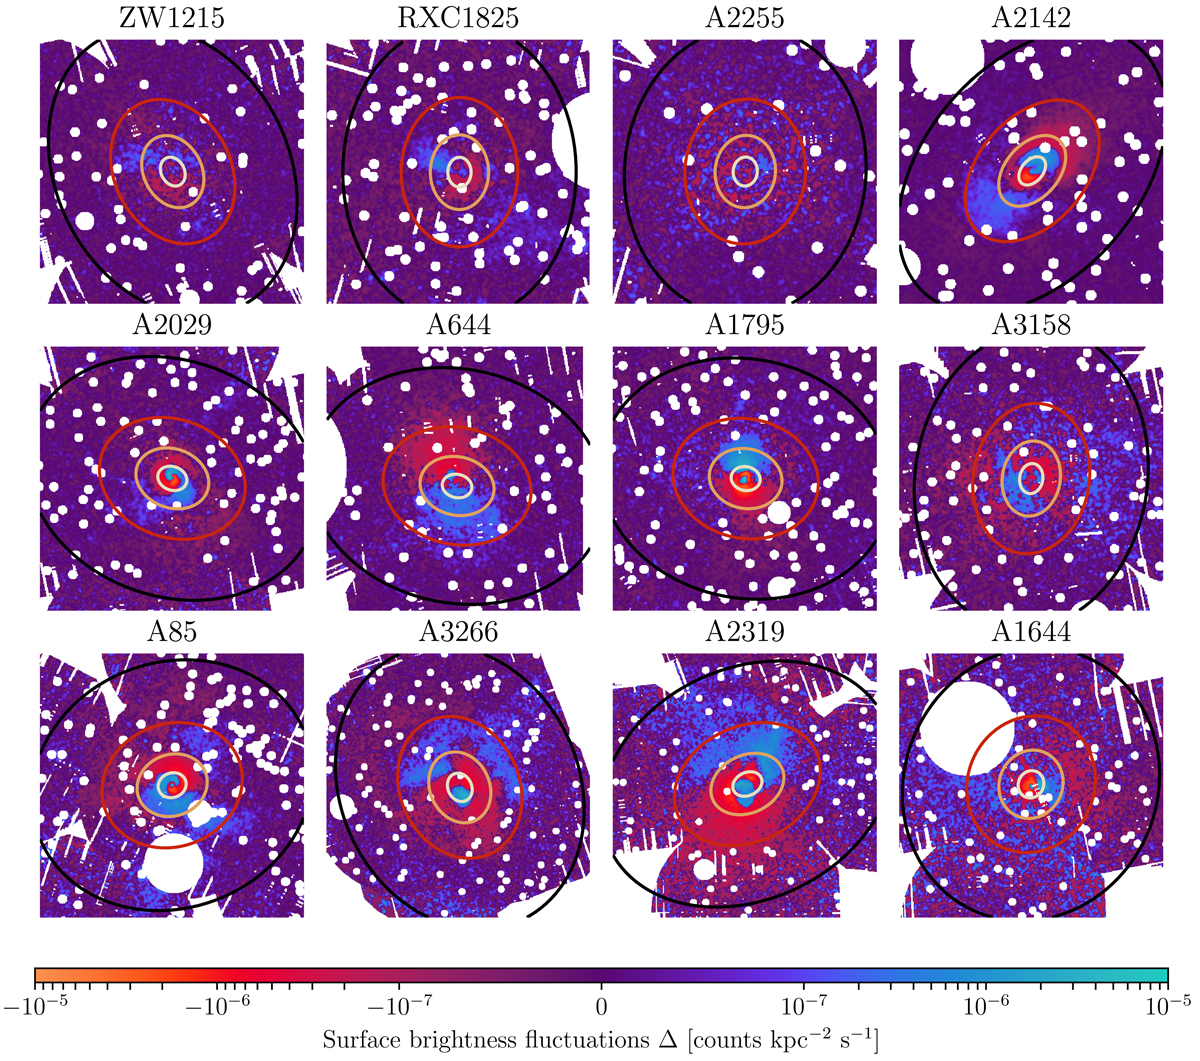
Surface brightness fluctuation maps, Δabs, from the absolute method (see Sect. 2.6) for the X-COP cluster sample. The successive contours represent the annular regions I, II, III, and IV with outer radii of 0.1, 0.25, 0.5 and 1R500, respectively. For display purposes, the images are filtered by a Gaussian kernel of 7.5″. Each image is ∼2.5 Mpc on a side. The images are ranked in ascending order of disturbance for the cluster as measured by the CZ coefficient (see Sect. 4.1).
Current usage metrics show cumulative count of Article Views (full-text article views including HTML views, PDF and ePub downloads, according to the available data) and Abstracts Views on Vision4Press platform.
Data correspond to usage on the plateform after 2015. The current usage metrics is available 48-96 hours after online publication and is updated daily on week days.
Initial download of the metrics may take a while.