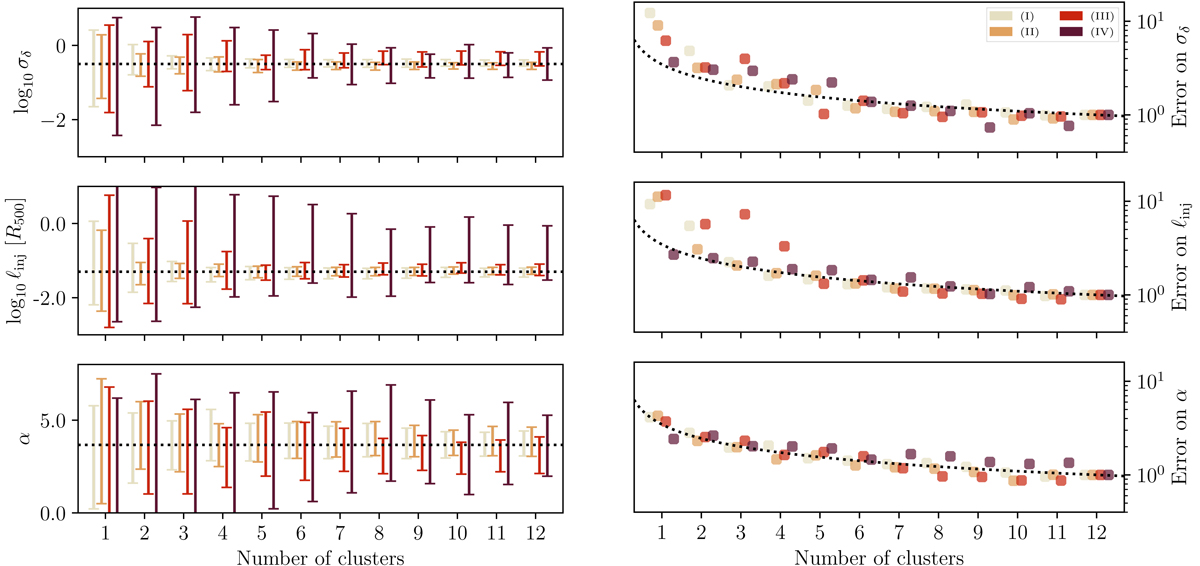
Fig. 3.
Download original image
Estimation of the posterior parameters and qualitative behaviour of the associated errors for mock observations with known parameters with an increasing number of clusters in the joint likelihood. For each point, we randomly draw N clusters ten times, compute the posterior parameter distributions and average the mean and standard deviation to alleviate the selection effect. The parameters are in each of the four regions as defined in Table (1). Left panel: mean and standard deviation of the parameters estimated for an increasing number cluster in the joint likelihood. The black line represents the true parameters. Right panel: error on each parameter compared to the number of cluster used to find the parameters, rescaled so that it is equal to 1 for N = 12. The black line shows the expected N−1/2 behaviour.
Current usage metrics show cumulative count of Article Views (full-text article views including HTML views, PDF and ePub downloads, according to the available data) and Abstracts Views on Vision4Press platform.
Data correspond to usage on the plateform after 2015. The current usage metrics is available 48-96 hours after online publication and is updated daily on week days.
Initial download of the metrics may take a while.