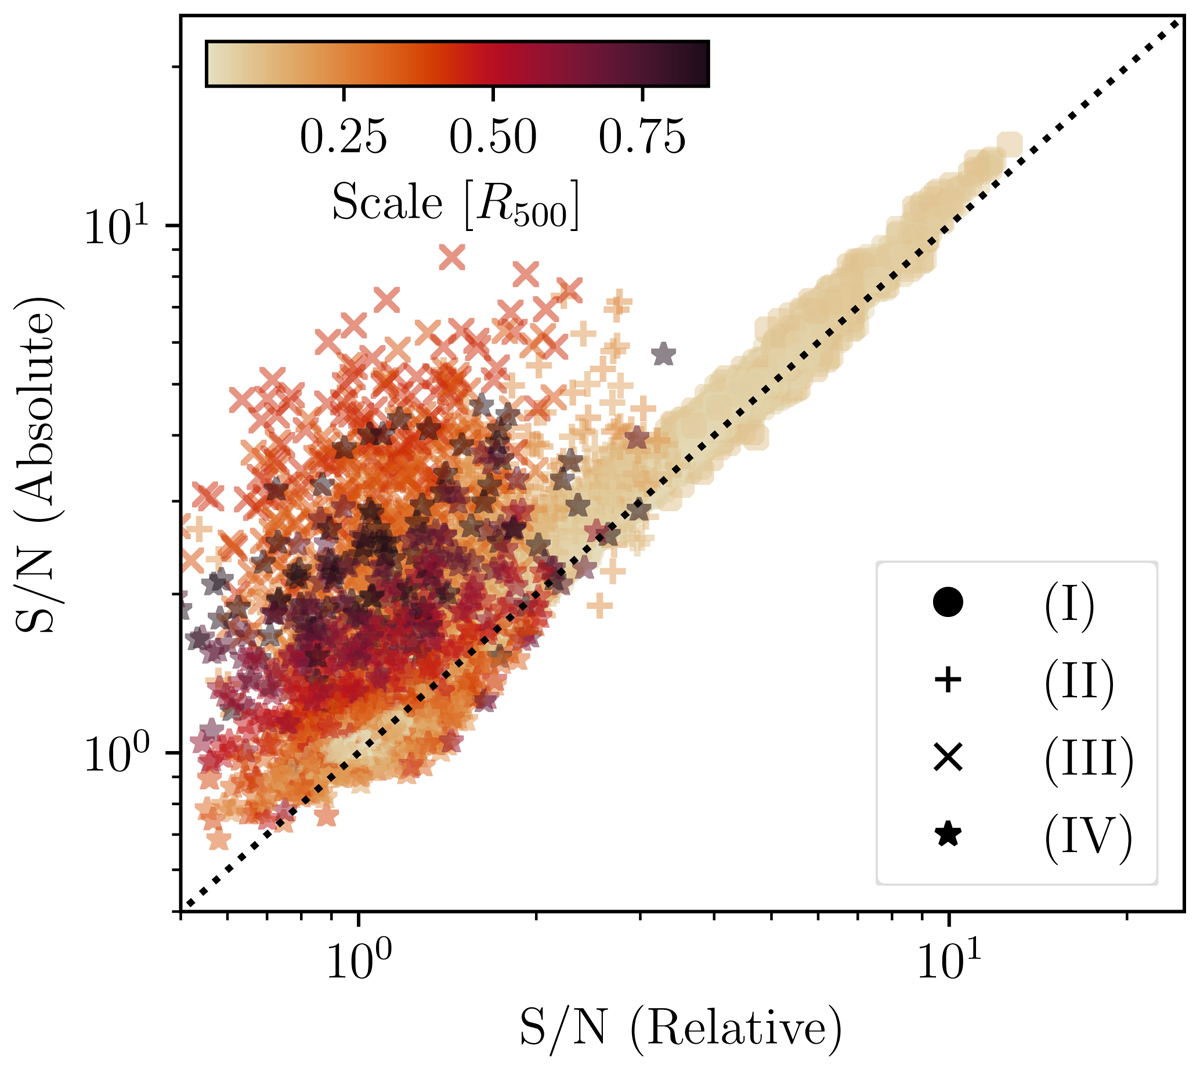
Fig. 2.
Download original image
Comparison of the S/N values obtained using the absolute and relative definition for surface brightness fluctuations, for different spatial scales and in the four regions defined in Table (1). The comparison is made for 100 mock spectra using the best-fit model and the exposure map of A3266, with density fluctuation parameters fixed at σδ = 0.32, ℓinj = 0.05R500 and α = 11/3.
Current usage metrics show cumulative count of Article Views (full-text article views including HTML views, PDF and ePub downloads, according to the available data) and Abstracts Views on Vision4Press platform.
Data correspond to usage on the plateform after 2015. The current usage metrics is available 48-96 hours after online publication and is updated daily on week days.
Initial download of the metrics may take a while.