Open Access
Fig. G.1.
Download original image
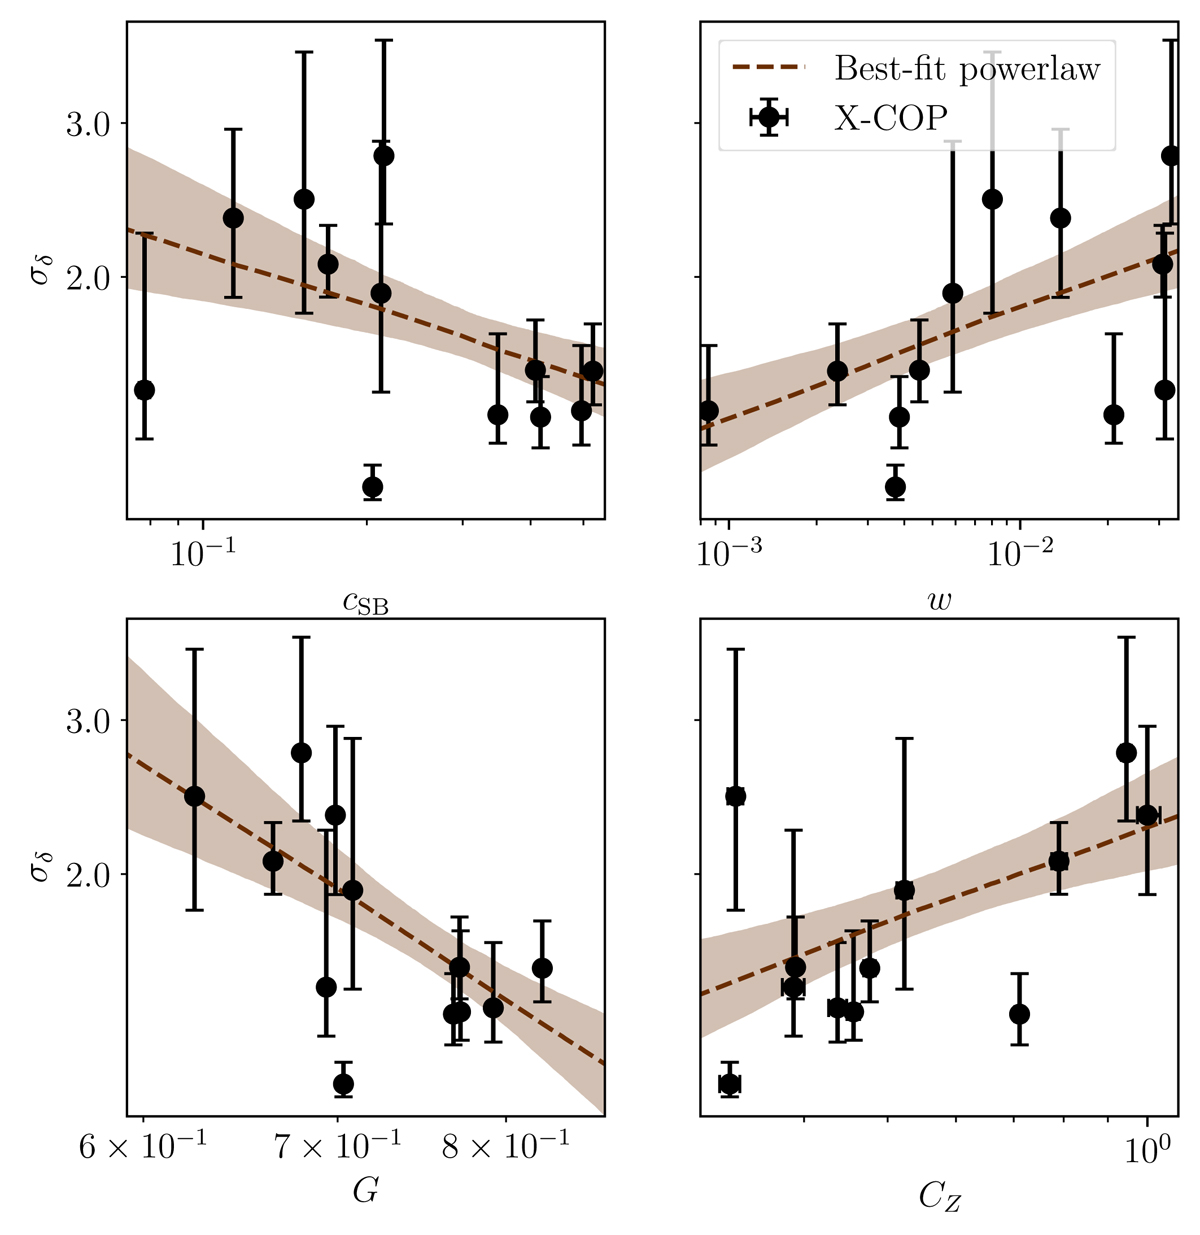
Correlation between σδ evaluated in R500 for each cluster and themorphological indicators defined in Sect. 4.1. The plain line and enveloprepresent the median and 16th-84th percentiles of the best fit of a power lawscaling.
Current usage metrics show cumulative count of Article Views (full-text article views including HTML views, PDF and ePub downloads, according to the available data) and Abstracts Views on Vision4Press platform.
Data correspond to usage on the plateform after 2015. The current usage metrics is available 48-96 hours after online publication and is updated daily on week days.
Initial download of the metrics may take a while.