Fig. 10.
Download original image
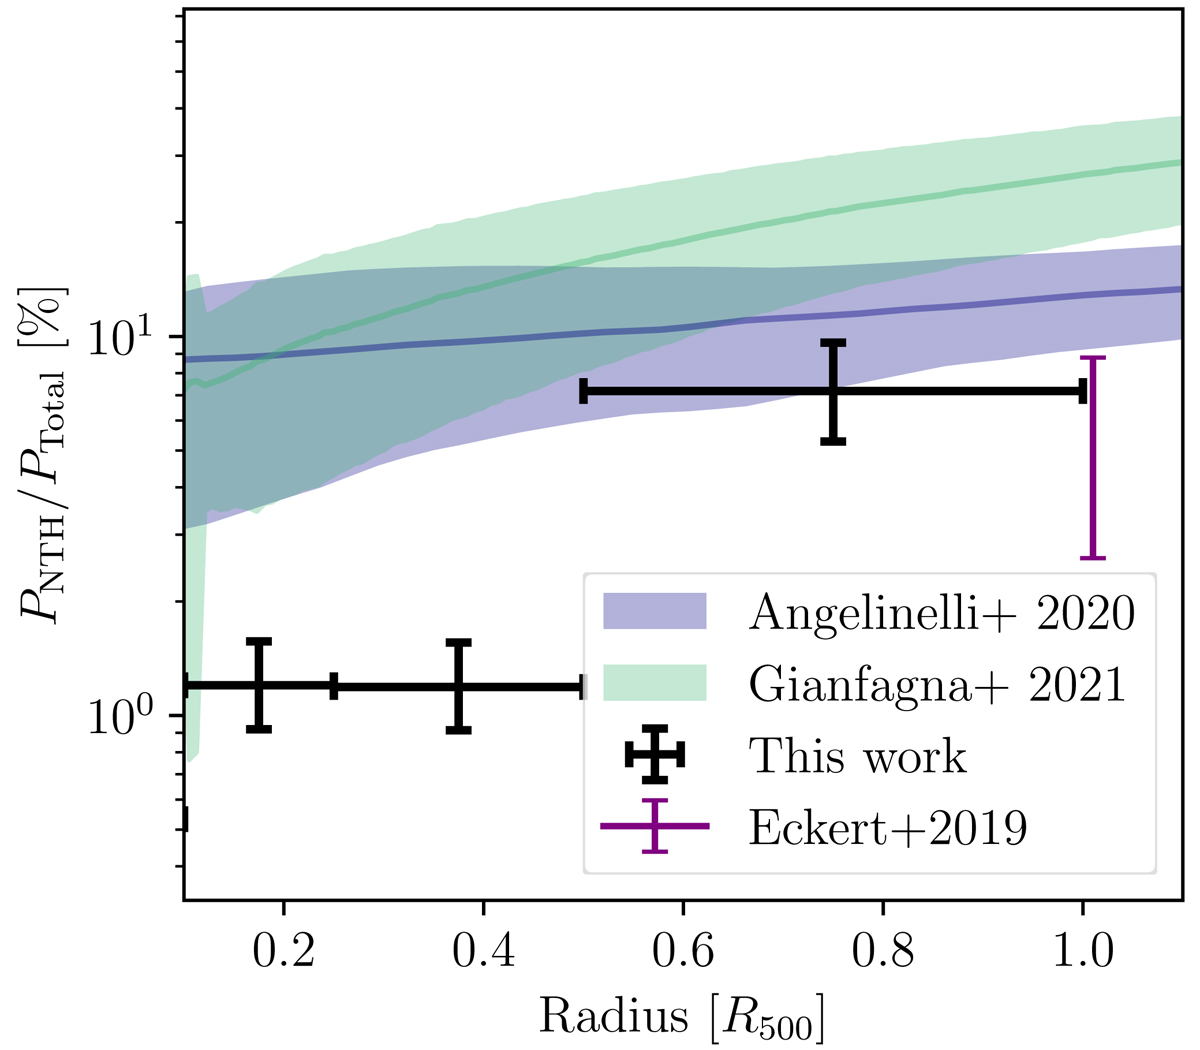
Comparison of the fraction of turbulent to the hydrostatic pressure in the ICM as measured for the X-COP sample (black points), compared to the previous determination at R500 by Eckert et al. (2019, green point). The blue and green line and associated shade envelope shows the predictions for non-thermal pressure support from the numerical simulations by Gianfagna et al. (2021) with the MUSIC clusters and Angelinelli et al. (2020) with the ITASCA clusters.
Current usage metrics show cumulative count of Article Views (full-text article views including HTML views, PDF and ePub downloads, according to the available data) and Abstracts Views on Vision4Press platform.
Data correspond to usage on the plateform after 2015. The current usage metrics is available 48-96 hours after online publication and is updated daily on week days.
Initial download of the metrics may take a while.