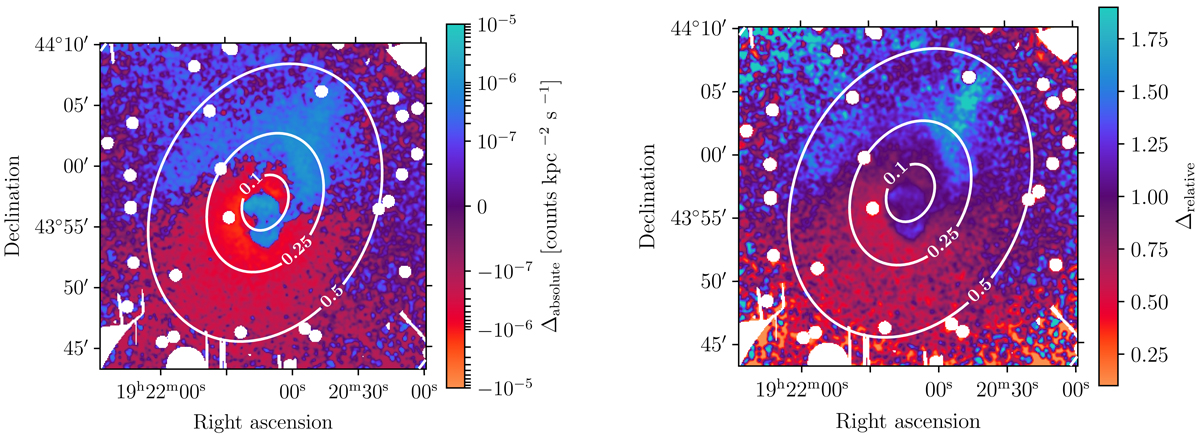
Fig. 1.
Download original image
Comparison between the absolute fluctuations Δabsolute from Eq. (8) (left) and the relative fluctuations Δrelative from Eq. (9) (right) using the surface brightness data and best fit model image of A2319. For display purposes, the images are filtered by a Gaussian kernel of 7.5″. The successive contours represent the distance to the centre in units of R500.
Current usage metrics show cumulative count of Article Views (full-text article views including HTML views, PDF and ePub downloads, according to the available data) and Abstracts Views on Vision4Press platform.
Data correspond to usage on the plateform after 2015. The current usage metrics is available 48-96 hours after online publication and is updated daily on week days.
Initial download of the metrics may take a while.