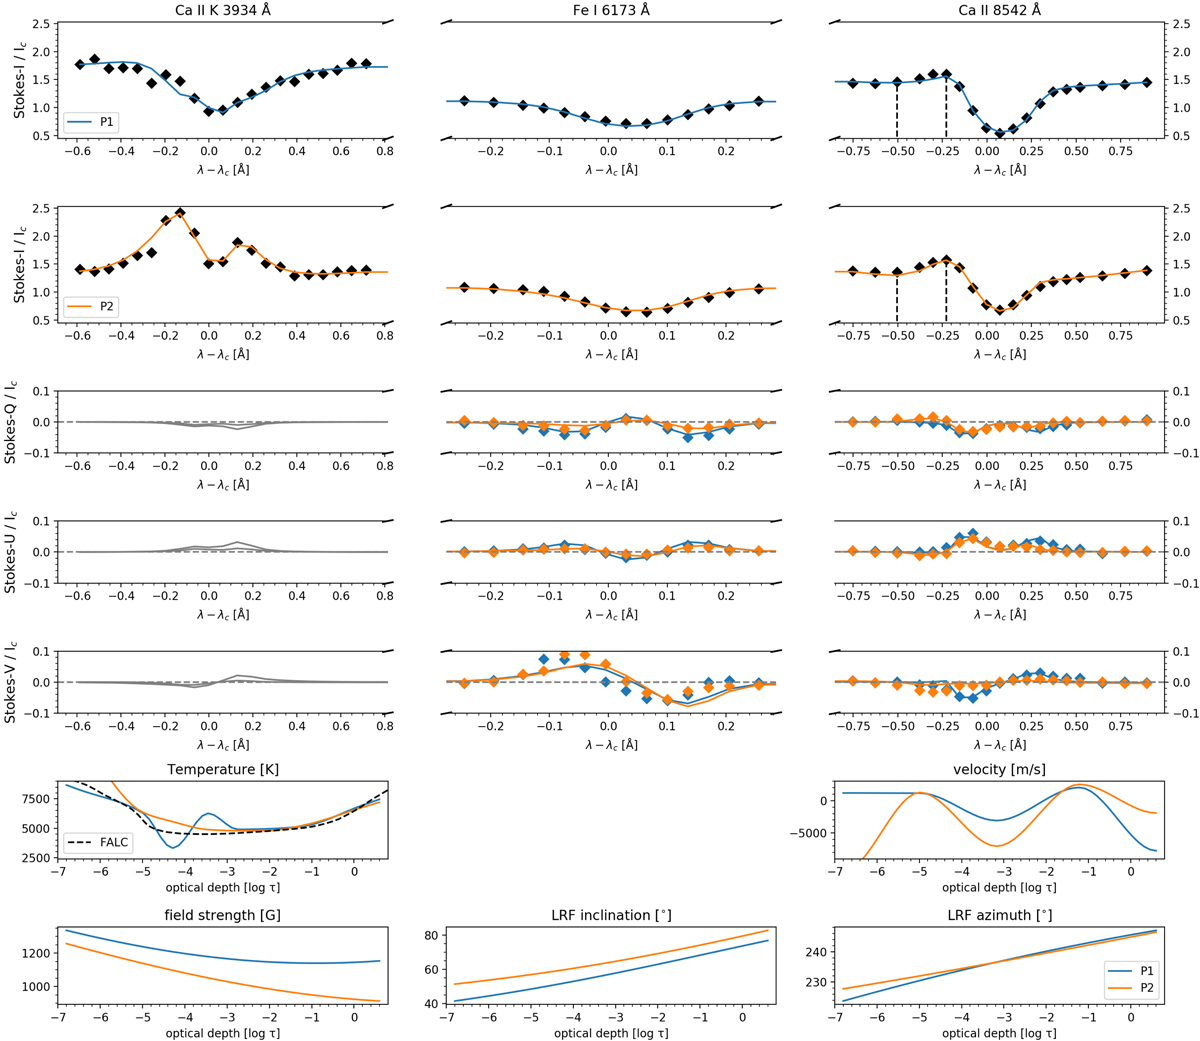
Fig. 8.
Download original image
Fit and corresponding depth-dependent atmospheric models from the STiC inversion for two example pixels P1 (blue solid lines) and P2 (orange solid lines). The observed wavelength points are shown as diamonds. For the Ca II K 3934 Å line, only the synthesized spectra are available in polarimetry (solid gray lines). The locations of P1 and P2 are shown in Fig. 9. Vertical black-dashed lines in the Ca II 8542 Å line line spectra depict the wavelength positions, from which the difference maps shown in Fig. 7 are calculated.
Current usage metrics show cumulative count of Article Views (full-text article views including HTML views, PDF and ePub downloads, according to the available data) and Abstracts Views on Vision4Press platform.
Data correspond to usage on the plateform after 2015. The current usage metrics is available 48-96 hours after online publication and is updated daily on week days.
Initial download of the metrics may take a while.