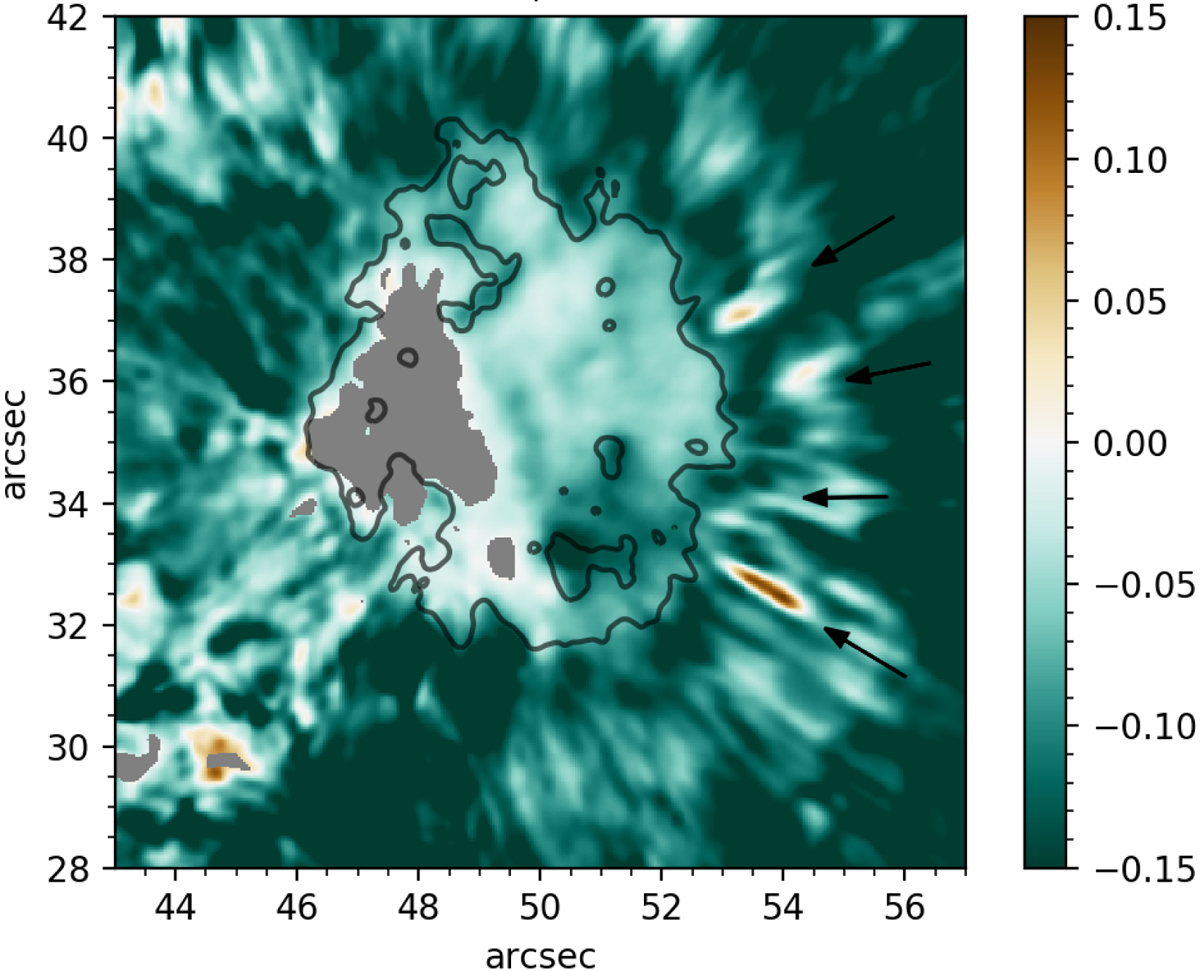
Fig. 7.
Download original image
Maps showing the blue-wing slope, as calculated from the intensity difference I(λc − 0.23 Å) − I(λc − 0.50 Å) for the Ca II 8542 Å line. Pixels showing a strong line core emission are masked out in gray. Time step: tobs = 02 min 55 s. The black contour outlining the pore was produced from the CHROMIS image at the continuum wavelength point at 4000 Å.
Current usage metrics show cumulative count of Article Views (full-text article views including HTML views, PDF and ePub downloads, according to the available data) and Abstracts Views on Vision4Press platform.
Data correspond to usage on the plateform after 2015. The current usage metrics is available 48-96 hours after online publication and is updated daily on week days.
Initial download of the metrics may take a while.