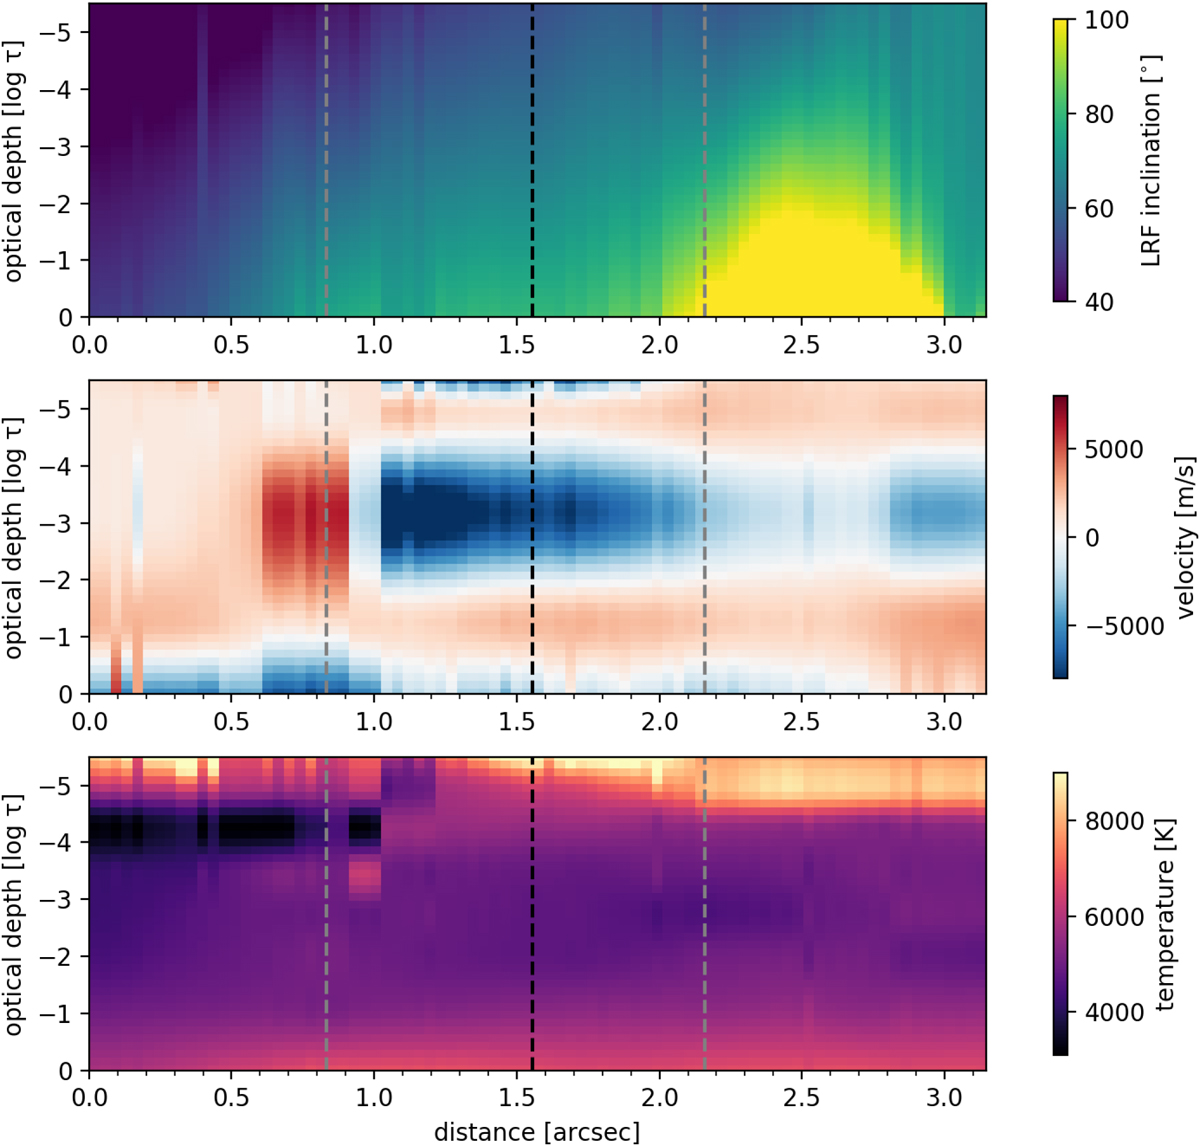
Fig. 10.
Download original image
Vertical cut through the STiC model atmosphere along the red-dashed line. The distance of 0″ corresponds to the left end of the line (close to the pore) and the distance of 3.1″ corresponds to its right end. The location of the kink in the red line (close to pixel P2) is depicted as vertical black-dashed lines. The intersections of the gray contour from Fig. 9 with the red-dashed line are depicted with gray-dashed lines. The value range of the inclination map was set to [40,100] to allow for direct comparisons to other maps.
Current usage metrics show cumulative count of Article Views (full-text article views including HTML views, PDF and ePub downloads, according to the available data) and Abstracts Views on Vision4Press platform.
Data correspond to usage on the plateform after 2015. The current usage metrics is available 48-96 hours after online publication and is updated daily on week days.
Initial download of the metrics may take a while.