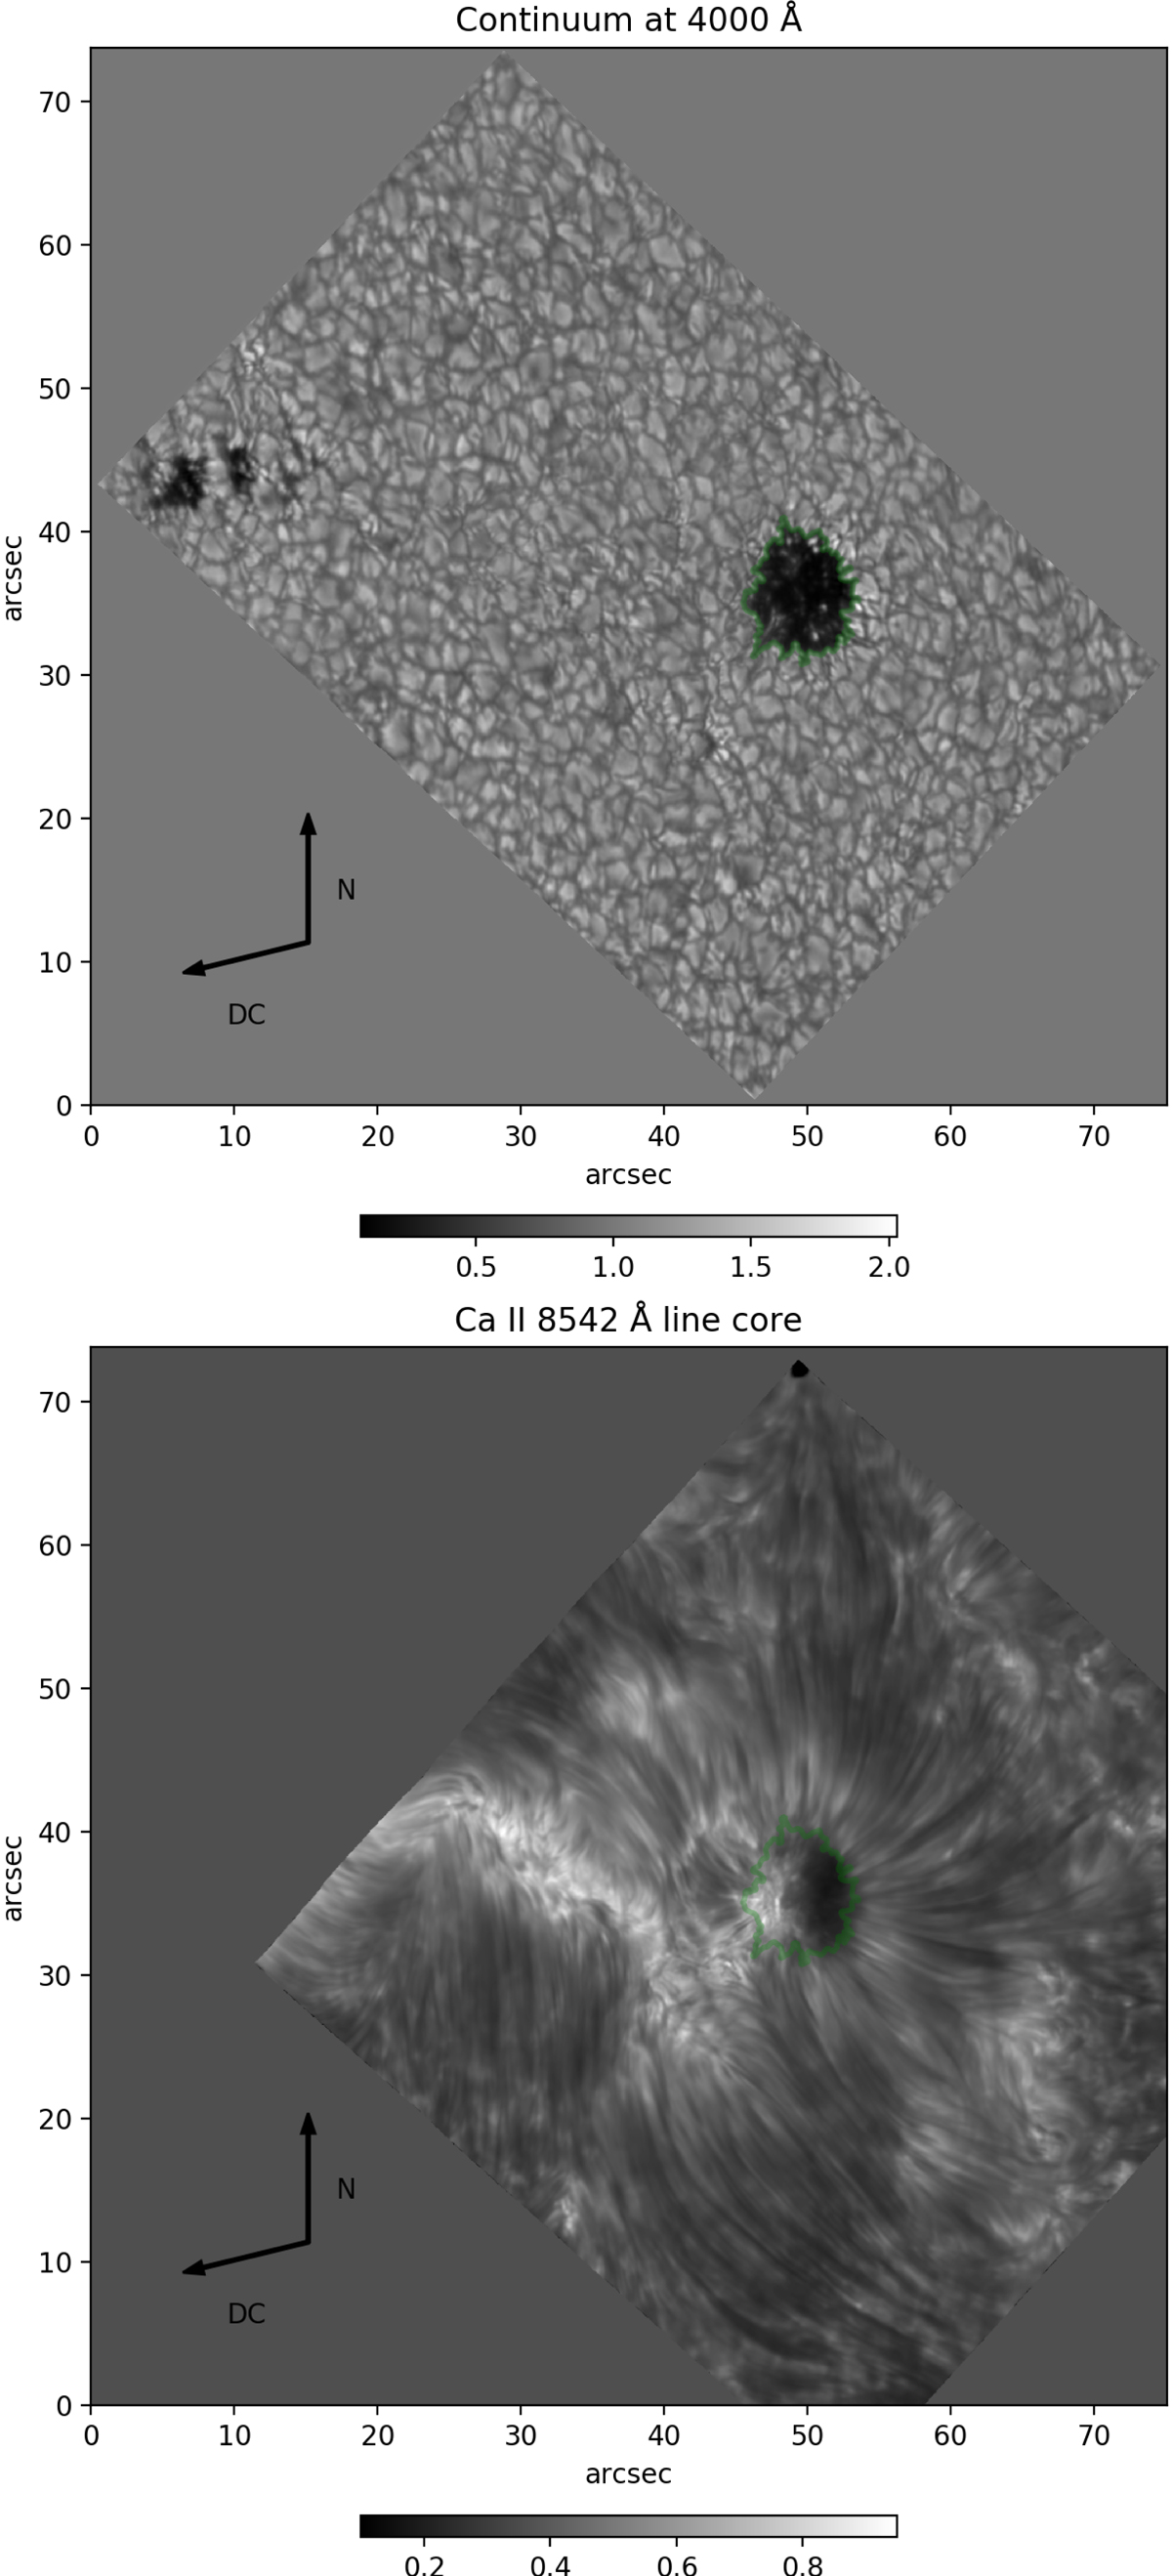
Fig. 1.
Download original image
Full FOV maps showing an image at the continuum wavelength point for CHROMIS at 4000 Å (top) and one image at wavelength in the core of the Ca II 8542 Å line for CRISP (bottom). The intensities were normalized, separately for each line, to the (quasi) continuum value averaged over a quiet sun region at the bottom of the FOV. The time step shown here is the first one at 10:33 UT. The green contour outlining the pore was produced from the CHROMIS image at the continuum wavelength point at 4000 Å.
Current usage metrics show cumulative count of Article Views (full-text article views including HTML views, PDF and ePub downloads, according to the available data) and Abstracts Views on Vision4Press platform.
Data correspond to usage on the plateform after 2015. The current usage metrics is available 48-96 hours after online publication and is updated daily on week days.
Initial download of the metrics may take a while.