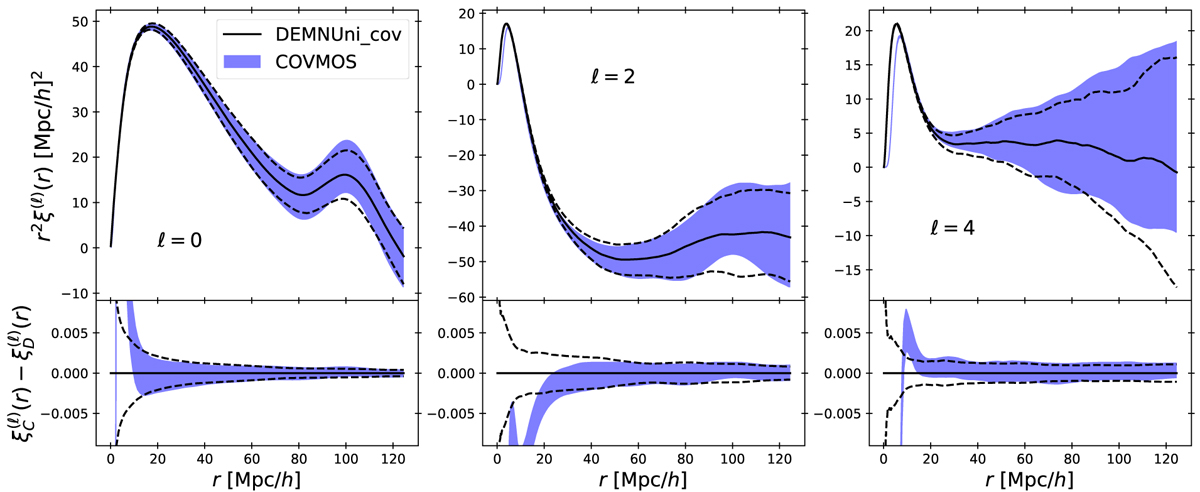
Fig. 9.
Download original image
Redshift-space two-point correlation function multipoles comparison between the COVMOS and the DEMNUni_cov experiments. Top: average of the estimated two-point correlation function multipoles over 100 realisations of COVMOS catalogues in 16nu cosmology, at z = 0 with dispersion on each realisation represented in blue. The solid black line represents the same (with dispersion over measurements in dashed black lines) for DEMNUni_cov simulations. Bottom: residual between the averaged COVMOS and DEMNUni_cov multipoles with corresponding error bars.
Current usage metrics show cumulative count of Article Views (full-text article views including HTML views, PDF and ePub downloads, according to the available data) and Abstracts Views on Vision4Press platform.
Data correspond to usage on the plateform after 2015. The current usage metrics is available 48-96 hours after online publication and is updated daily on week days.
Initial download of the metrics may take a while.