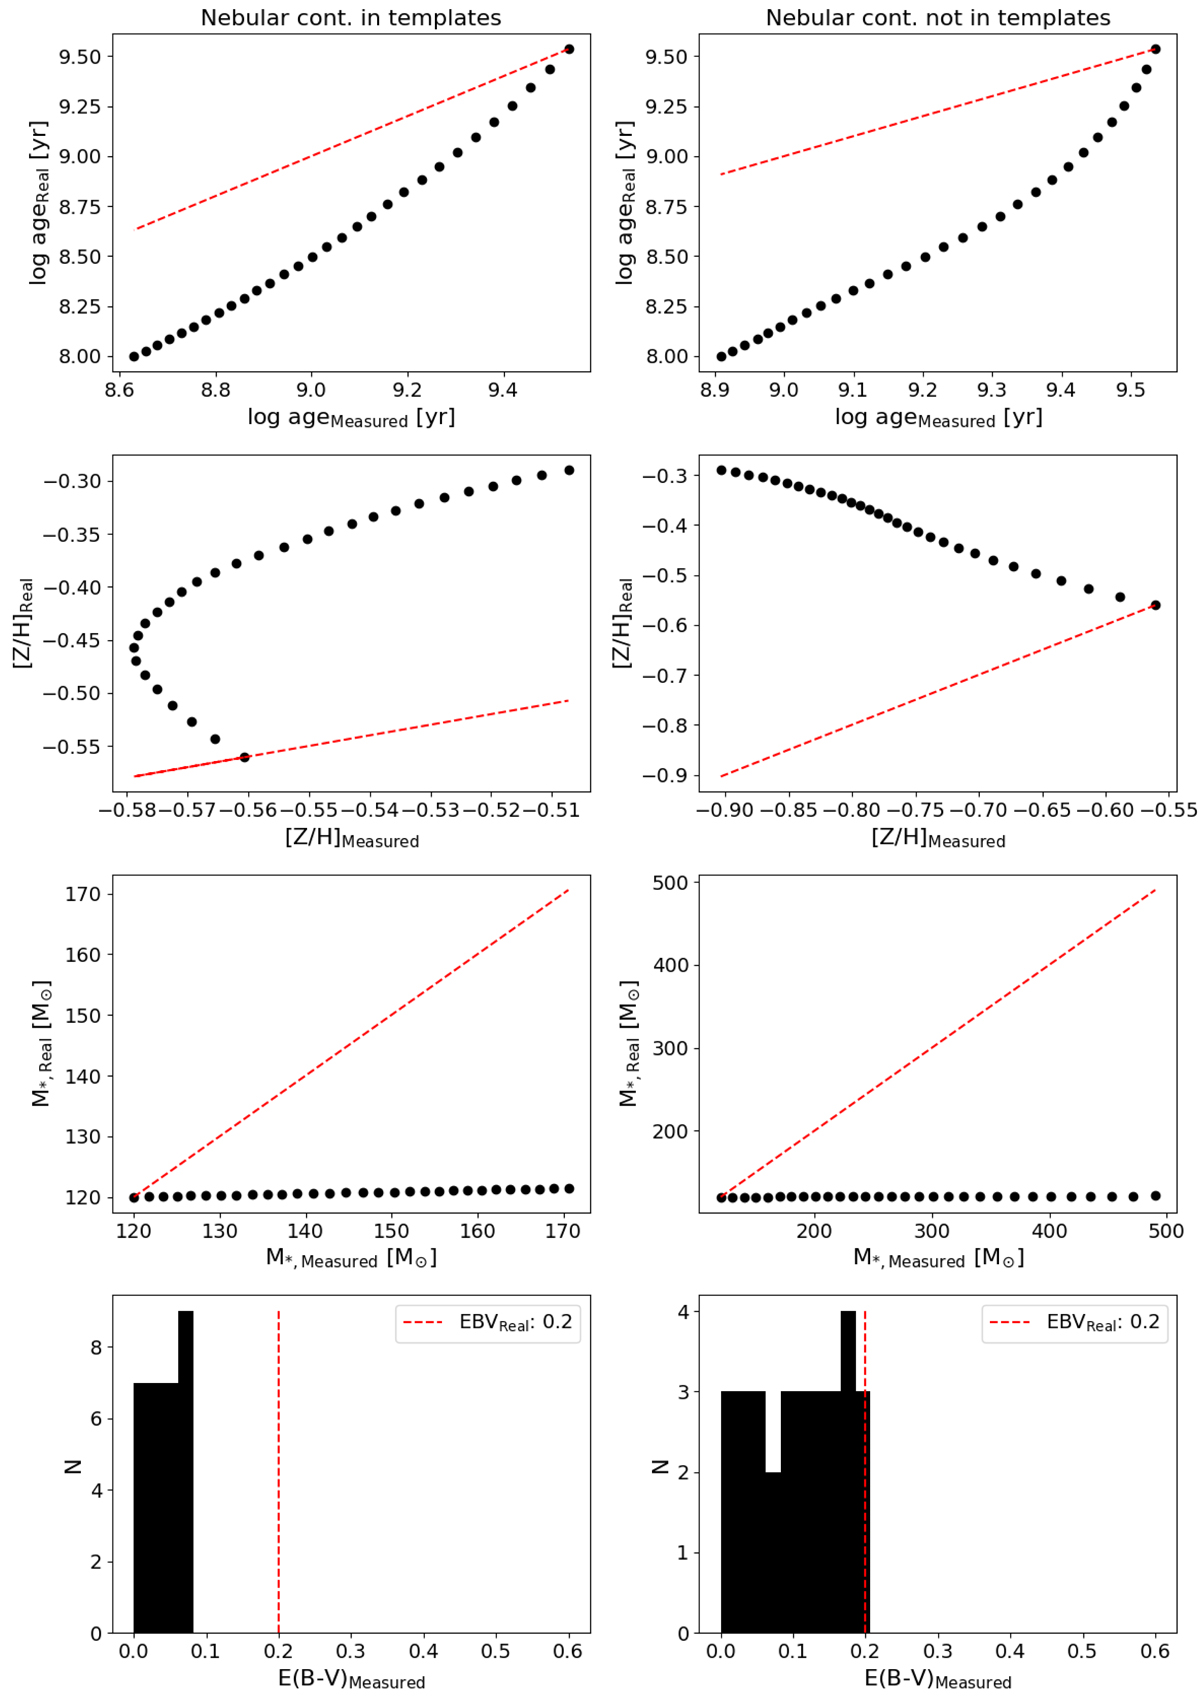
Fig. E.14.
Download original image
Analogous to Fig. E.8, but in this case, dust extinction (E(B-V) = 0.2) has been applied only to the SED of the youngest stellar population. The left column shows the results obtained when nebular continuum emission is accounted for in the templates used to fit the data, and the right column shows the same results when nebular continuum emission is neglected from the fitting. The figure shows that even when the templates used to build the mock spectra are identical to the templates used to measure their stellar properties, the measured age, metallicity, mass, and extinction values are severely biased respect to the real values.
Current usage metrics show cumulative count of Article Views (full-text article views including HTML views, PDF and ePub downloads, according to the available data) and Abstracts Views on Vision4Press platform.
Data correspond to usage on the plateform after 2015. The current usage metrics is available 48-96 hours after online publication and is updated daily on week days.
Initial download of the metrics may take a while.