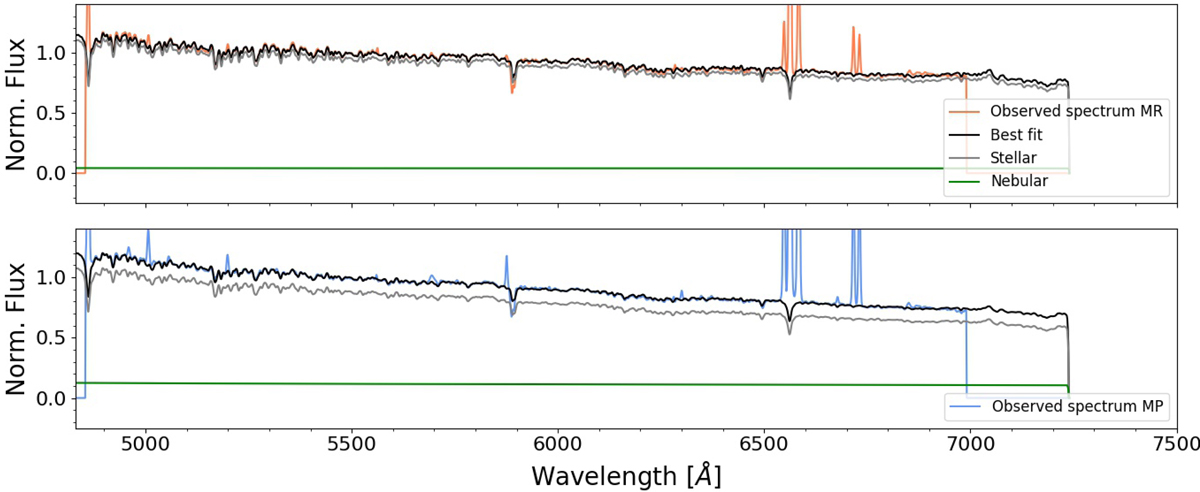
Fig. E.6.
Download original image
Best SED-fitting obtained with FADO for the MR and MP regions, defined in Fig. E.5. The orange and blue lines represent the MR and MP observed spectra, respectively. The black line show the best-fitting model, and the gray and green curves show separately the stellar and nebular continuum contribution, respectively. It is clear that the MP region (bottom) requires a more significant contribution of nebular continuum than the MR (top) region.
Current usage metrics show cumulative count of Article Views (full-text article views including HTML views, PDF and ePub downloads, according to the available data) and Abstracts Views on Vision4Press platform.
Data correspond to usage on the plateform after 2015. The current usage metrics is available 48-96 hours after online publication and is updated daily on week days.
Initial download of the metrics may take a while.