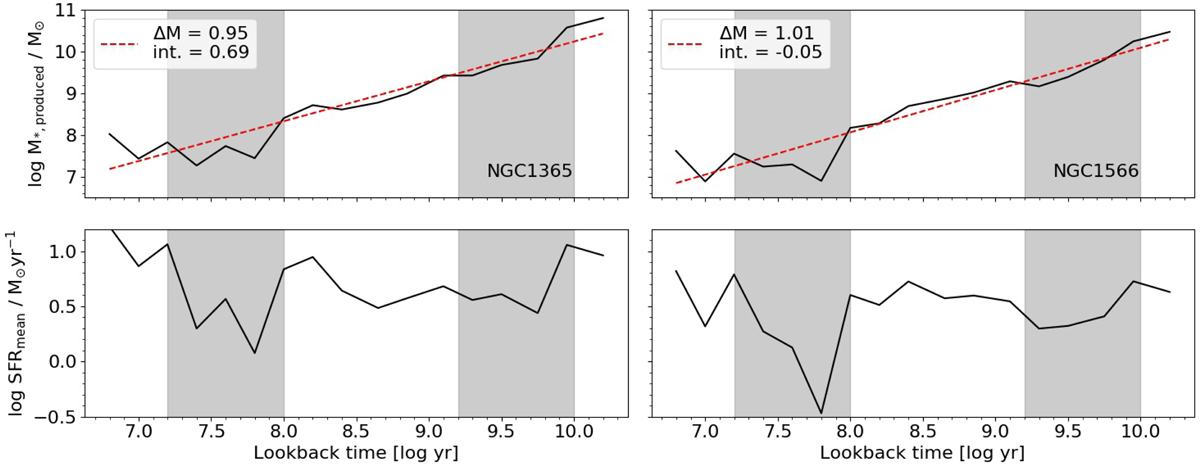
Fig. C.1.
Download original image
Star formation history (top) and star formation rate history (bottom) derived for NGC 1365 (left) and NGC 1566 (right). The best-fitting linear model for the SFH curve of each galaxy is shown as a red dashed line, and its slope and intercept are shown in the top-left corner of the top panels. The shaded areas mark sudden decreases in the SFR at ages log (age/yr) ∼7.7 and log (age/yr) ∼9.5, found to exist in all galaxies in some degree, deemed as an artifact of the computed SFHs.
Current usage metrics show cumulative count of Article Views (full-text article views including HTML views, PDF and ePub downloads, according to the available data) and Abstracts Views on Vision4Press platform.
Data correspond to usage on the plateform after 2015. The current usage metrics is available 48-96 hours after online publication and is updated daily on week days.
Initial download of the metrics may take a while.