Fig. 17.
Download original image
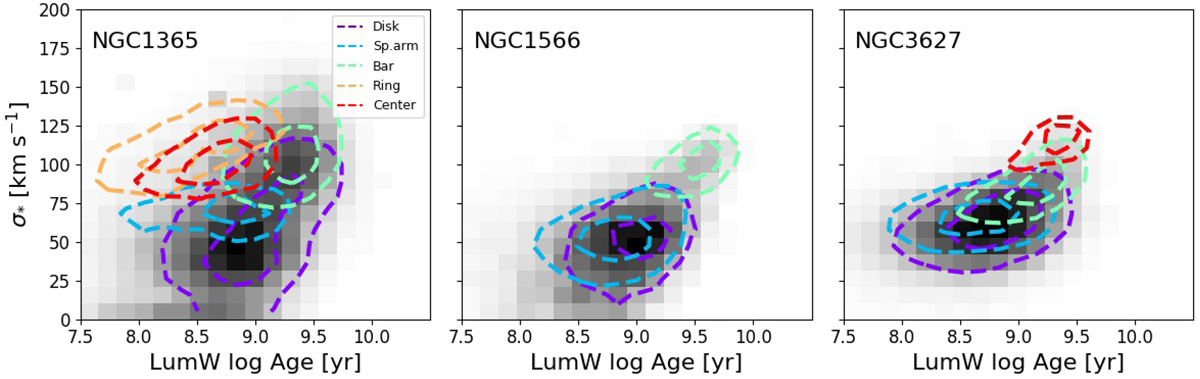
2D histogram that shows the distribution of stellar velocity dispersion (σ*) and log age (luminosity-weighted), for NGC 1365 (left), NGC 1566 (center), and NGC 3627 (right). The color of each [LumW log Age, σ*] bin scales with the number of pixels within that bin. The contours show the one- and two-sigma limits of the distribution of each individual galactic environment, following the color code indicated in the top-right corner of the right of the panel.
Current usage metrics show cumulative count of Article Views (full-text article views including HTML views, PDF and ePub downloads, according to the available data) and Abstracts Views on Vision4Press platform.
Data correspond to usage on the plateform after 2015. The current usage metrics is available 48-96 hours after online publication and is updated daily on week days.
Initial download of the metrics may take a while.