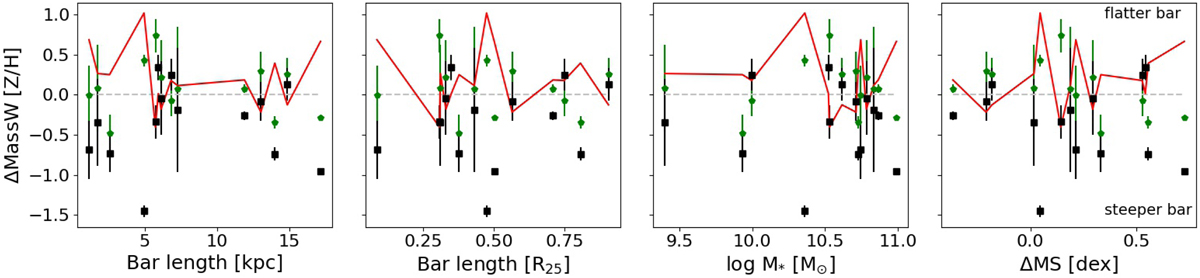
Fig. 16.
Download original image
Mass-weighted [Z/H] gradients measured along bar major axis (green pentagons), and along its perpendicular direction (black squares), as a function of the bar length (in units kpc and R25), total stellar mass, and offset from the global main sequence of galaxies (ΔMS), for 14 barred galaxies in our sample. The red line is calculated following Eq. (5). It is defined to be positive in galaxies that show a flatter gradient along their bar major axis, compared to the bar perpendicular direction, and negative values otherwise.
Current usage metrics show cumulative count of Article Views (full-text article views including HTML views, PDF and ePub downloads, according to the available data) and Abstracts Views on Vision4Press platform.
Data correspond to usage on the plateform after 2015. The current usage metrics is available 48-96 hours after online publication and is updated daily on week days.
Initial download of the metrics may take a while.