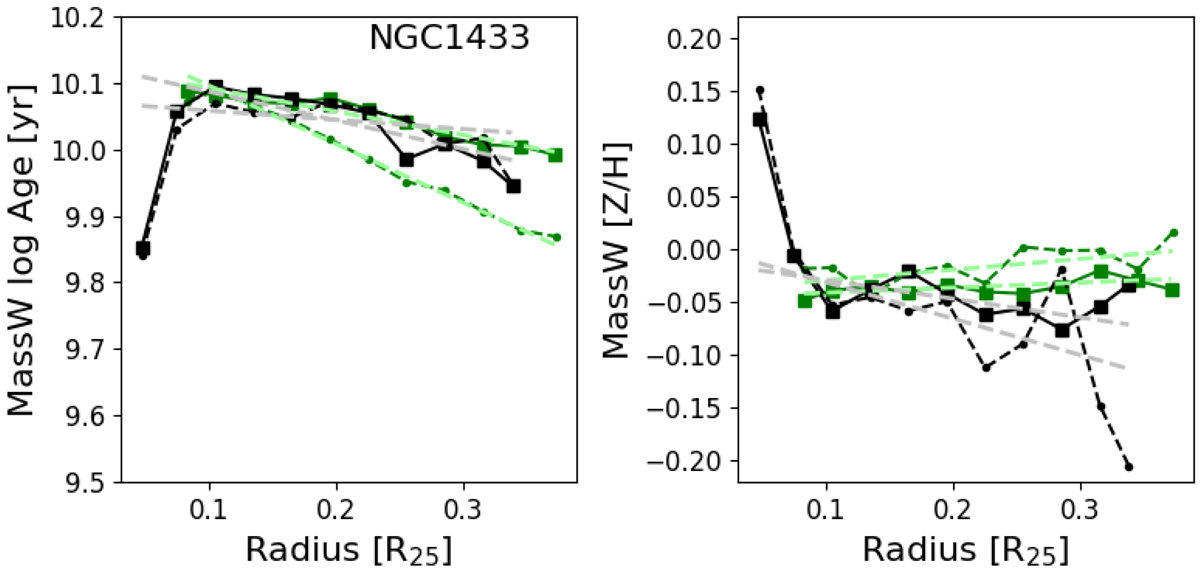
Fig. 14.
Download original image
Mass-weighted age (left) and [Z/H] (right) radial profiles along the bar major axis (dark green), and along its perpendicular direction (black), for NGC 1433. The solid and dashed dark green and black lines represent the gradient measured toward each possible direction from the center. The pale green dashed lines show the best-fitting linear model to the bar major axis gradient (dark green lines), and the silver dashed lines show the best-fitting to the gradients measured in the direction perpendicular to the bar.
Current usage metrics show cumulative count of Article Views (full-text article views including HTML views, PDF and ePub downloads, according to the available data) and Abstracts Views on Vision4Press platform.
Data correspond to usage on the plateform after 2015. The current usage metrics is available 48-96 hours after online publication and is updated daily on week days.
Initial download of the metrics may take a while.