Fig. 11.
Download original image
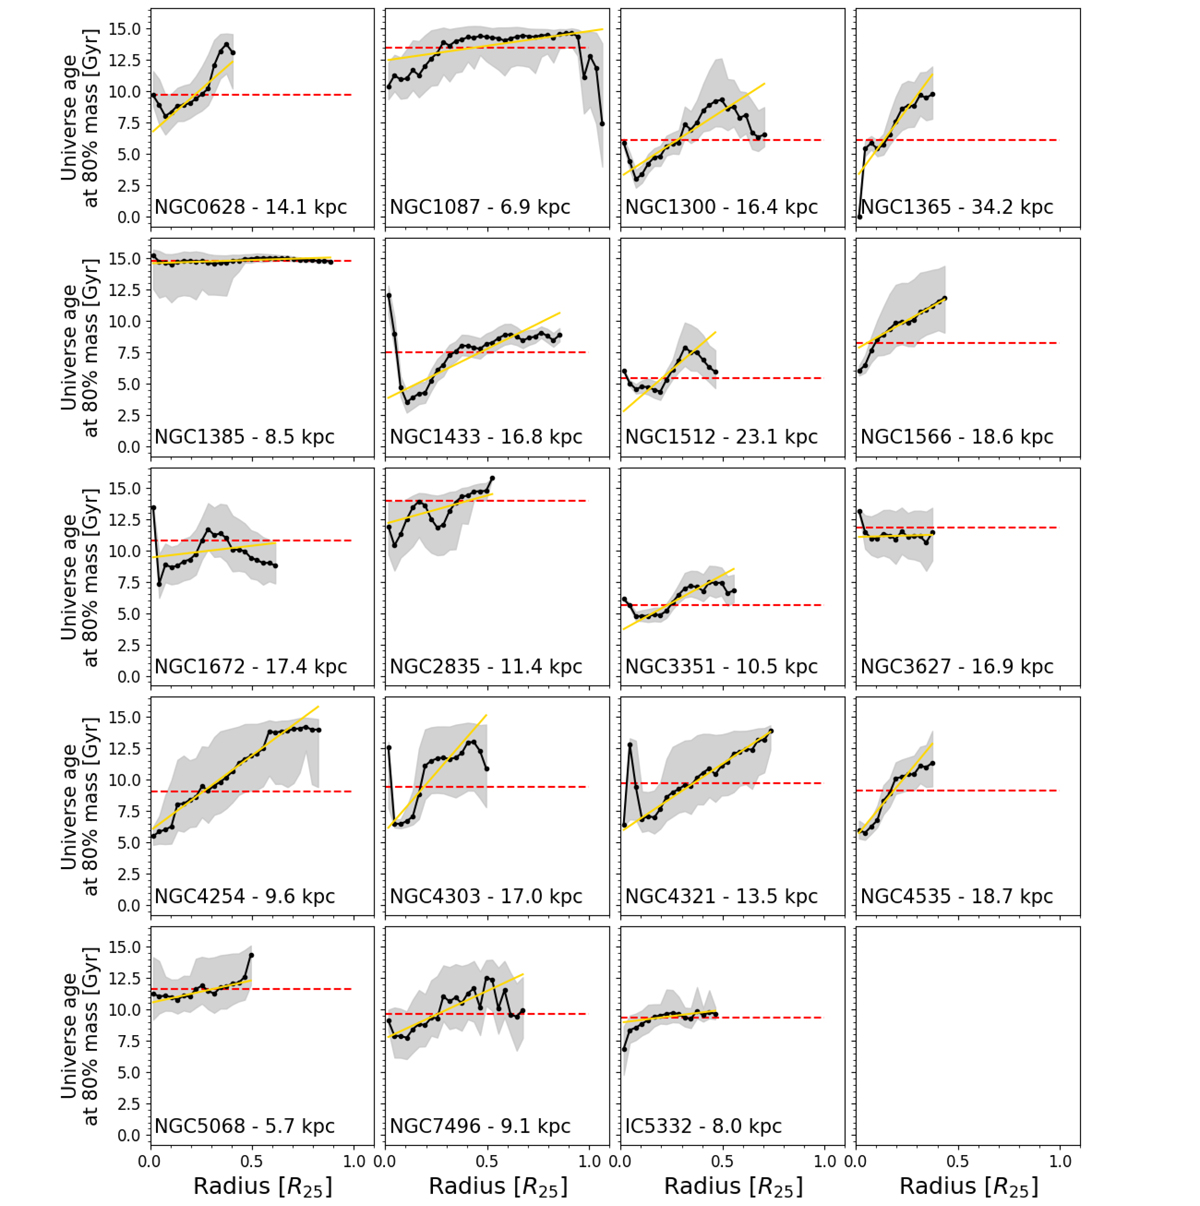
Radial assembly history of our sample galaxies. The y-axis shows the age of the Universe at which each radial bin assembled 80% of its total current stellar mass. A positive trend in these plots implies that outer regions assembled their stellar mass later in cosmic history than inner regions. The yellow solid lines show the best-fit linear model for each galaxy. The red dashed line show the time at which the full galaxy formed 80% of its total current stellar mass. The gray shaded area represents the uncertainty in our measurement, estimated by propagating the stellar mass uncertainty in the integration of the SFH of each radial bin. The value of R25 (kpc) of each galaxy is indicated in each corresponding panel. The bottom-right panel displays the trends for all galaxies, color-coded by total stellar mass. By construction, the highest possible value for the y-axis is given by the age of our oldest age bin in the SSP fitting (∼15 Gyr, see Sect. 2.2).
Current usage metrics show cumulative count of Article Views (full-text article views including HTML views, PDF and ePub downloads, according to the available data) and Abstracts Views on Vision4Press platform.
Data correspond to usage on the plateform after 2015. The current usage metrics is available 48-96 hours after online publication and is updated daily on week days.
Initial download of the metrics may take a while.