Fig. A.1
Download original image
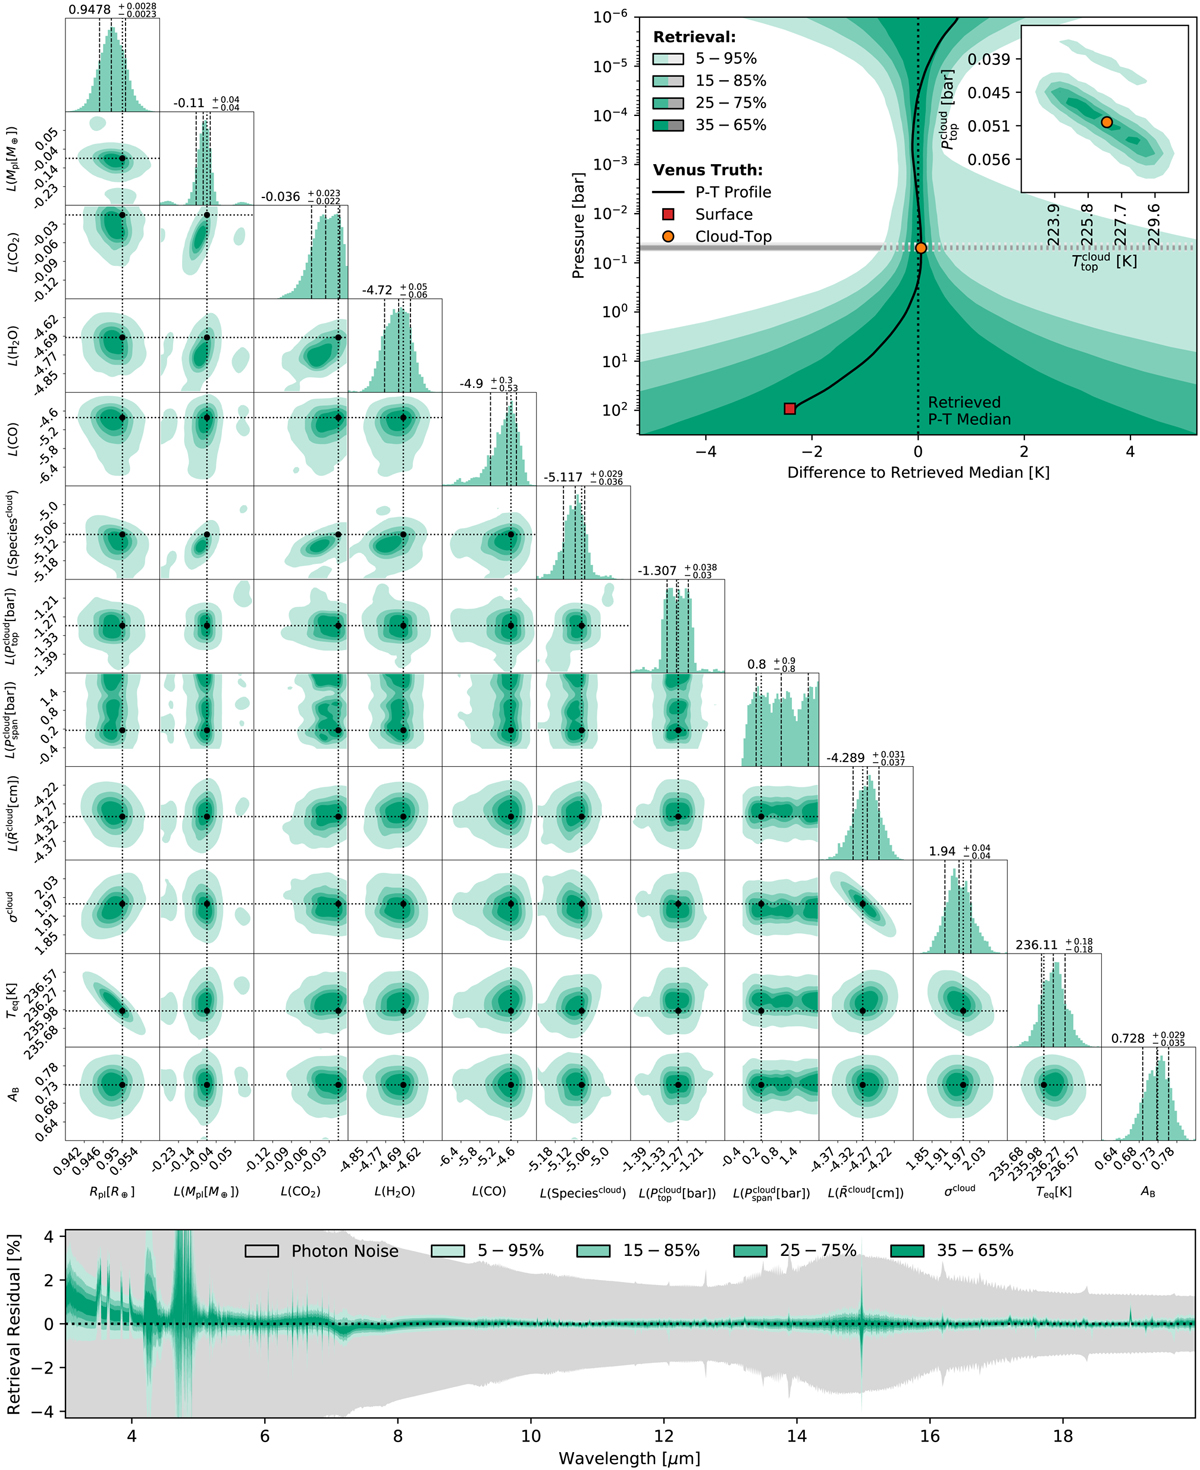
Results from the validation retrieval on the 3–20 μm, R = 1000, and photon noise S/N = 50 Venus-twin spectrum (opaque H2SO4 clouds) using the opaque H2SO4 cloud forward model. Top left: Corner plot of the posterior distribution of the forward model parameters. Here, L(·) stands for log10(·). We derived the equilibrium temperature Teq and the Bond albedo AB from the other posteriors (see Appendix B). The dotted black lines indicate the true values. In the 1D posteriors, we show the 16th, 50th, and 84th percentiles as black dashed lines. Top right: P–T profile residuals relative to the retrieved median P–T profile. Color-shaded regions indicate percentiles of the retrieved P–T profiles. The gray shaded regions indicate percentiles of the retrieved cloud-top pressure. The solid black line, the orange circular marker, and the red square marker represent the true Venus-twin P–T profile relative to the median retrieved P–T profile. In the inset figure, we plot the 2D P0-T0 posterior. Bottom: Residuals of the spectra corresponding to the retrieved posteriors relative to the Venus-twin input. Color-shaded areas represent different quantiles of the residuals. The gray area marks the 1σ photon noise level.
Current usage metrics show cumulative count of Article Views (full-text article views including HTML views, PDF and ePub downloads, according to the available data) and Abstracts Views on Vision4Press platform.
Data correspond to usage on the plateform after 2015. The current usage metrics is available 48-96 hours after online publication and is updated daily on week days.
Initial download of the metrics may take a while.