Fig. 8
Download original image
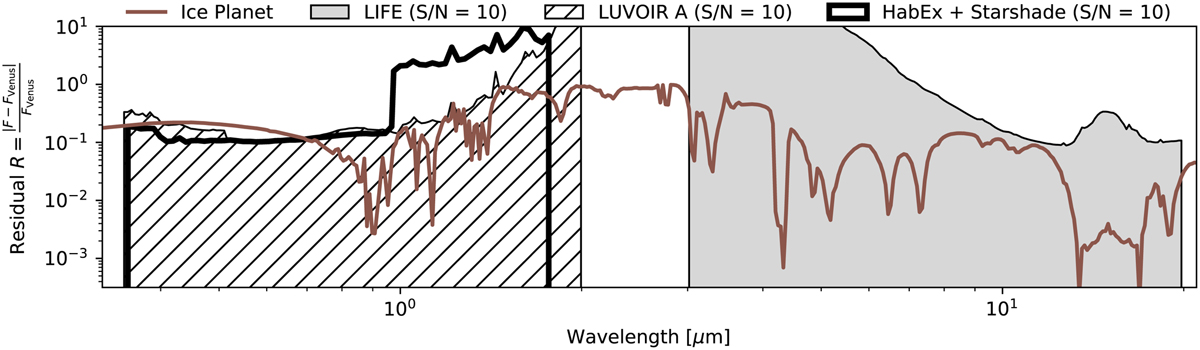
Flux difference between a cloudy Venus-twin exoplanet (opaque H2SO4 clouds) and an icy world with a thin CO2-dominated atmosphere (see Appendix E for a comparison of the absolute fluxes). In brown, we plot the flux residual of the icy world with respect to the Venus twin as a function of wavelength. The gray shaded region indicates the 1 σ LIFESIM noise level at S/N = 10. The thin, hatched, and black area represents the expected wavelength-dependent noise for the LUVOIR A mission concept (The LUVOIR Team 2019); the thick, solid black line represents the expected noise for the HabEx + Starshade mission concept (Gaudi et al. 2020).
Current usage metrics show cumulative count of Article Views (full-text article views including HTML views, PDF and ePub downloads, according to the available data) and Abstracts Views on Vision4Press platform.
Data correspond to usage on the plateform after 2015. The current usage metrics is available 48-96 hours after online publication and is updated daily on week days.
Initial download of the metrics may take a while.