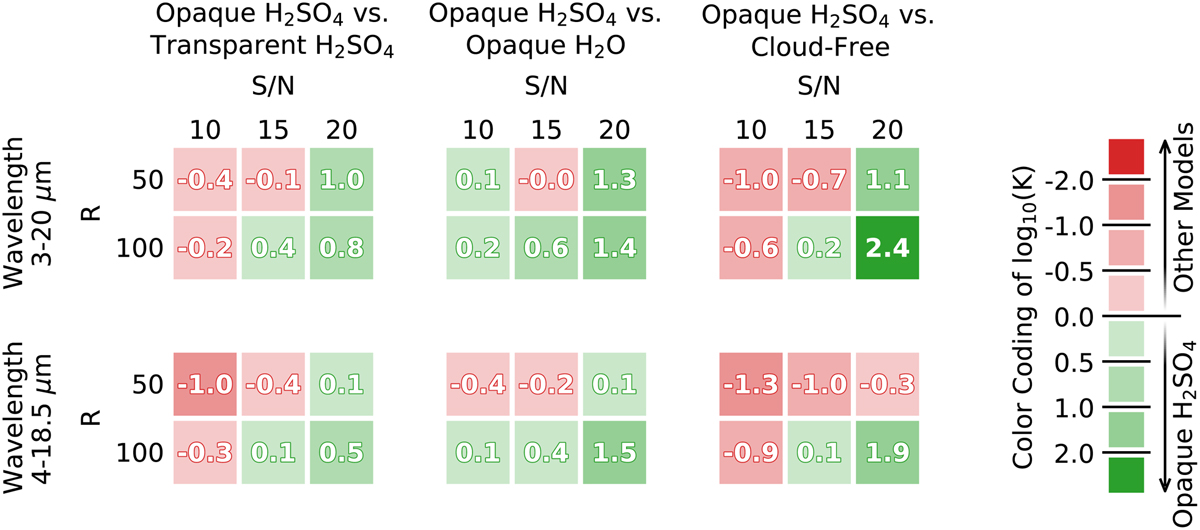
Fig. 7
Download original image
Comparison of the retrieval performance of the true opaque H2SO4 cloud model with the other models via the Bayes factor K. We use the Jeffreys scale as metric for comparison (see Table 4, Jeffreys 1998) and consider different wavelength coverages, R, and S/N of the simulated Venus-twin LIFE observations. Green squares (positive log10(K) values) indicate that the correct model (opaque H2SO4 clouds) is preferred, red squares (negative log10(K) values) mark preference for the incorrect model. The intensity of coloring represents the preference strength.
Current usage metrics show cumulative count of Article Views (full-text article views including HTML views, PDF and ePub downloads, according to the available data) and Abstracts Views on Vision4Press platform.
Data correspond to usage on the plateform after 2015. The current usage metrics is available 48-96 hours after online publication and is updated daily on week days.
Initial download of the metrics may take a while.