Fig. 6
Download original image
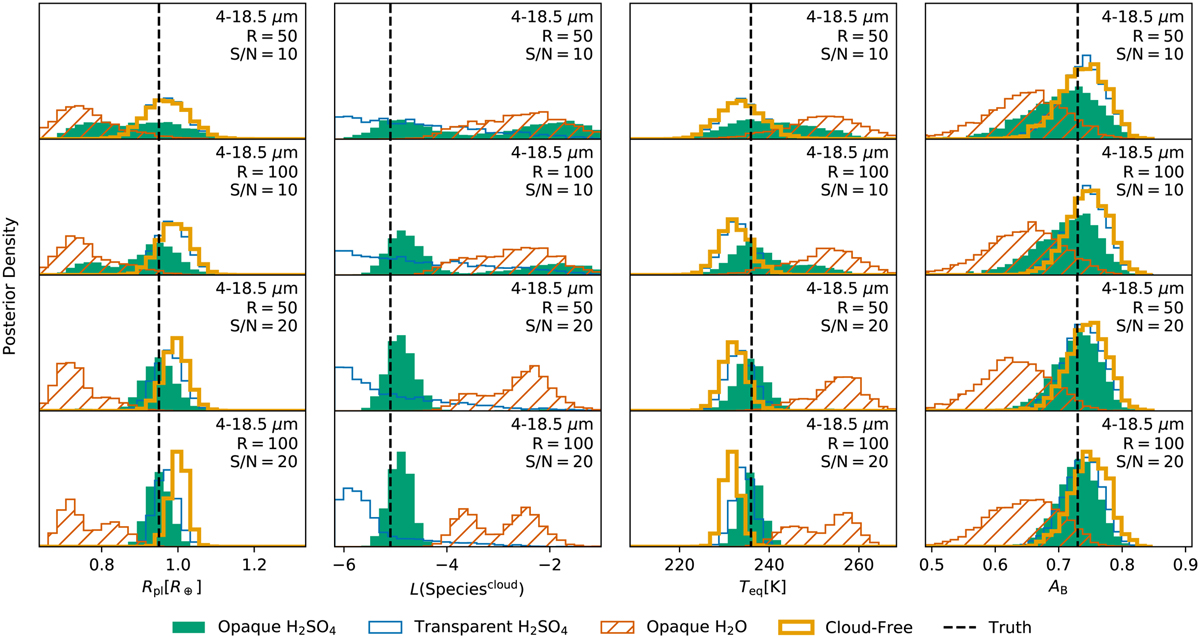
Model parameter posteriors for increased quality 4 – 18.5 µm Venus-twin spectra (opaque H2SO4 clouds). Here, L(·) abbreviates log10(·). Dashed black lines indicate the true values (see Table 1). For Speciescloud, the true value is the H2SO4 mass fraction in the Venus-twin model. Solid green area – opaque H2SO4 clouds; thin-blue outlined area – transparent H2SO4 clouds; orange-hatched area – opaque H2O clouds; thick-yellow outlined area – cloud-free. Columns (left to right) show the results for the planet radius Rpl, cloud species abundance Speciescloud, equilibrium temperature Teq, Bond albedo AB (Teq and AB were calculated following Appendix B; for the posteriors of all model parameters see Appendix D). Rows (top to bottom) represent different input qualities: R = 50, S/N = 10; R = 100, S/N = 10; R = 50, S/N = 20; R = 100, S/N = 20.
Current usage metrics show cumulative count of Article Views (full-text article views including HTML views, PDF and ePub downloads, according to the available data) and Abstracts Views on Vision4Press platform.
Data correspond to usage on the plateform after 2015. The current usage metrics is available 48-96 hours after online publication and is updated daily on week days.
Initial download of the metrics may take a while.