Fig. 4
Download original image
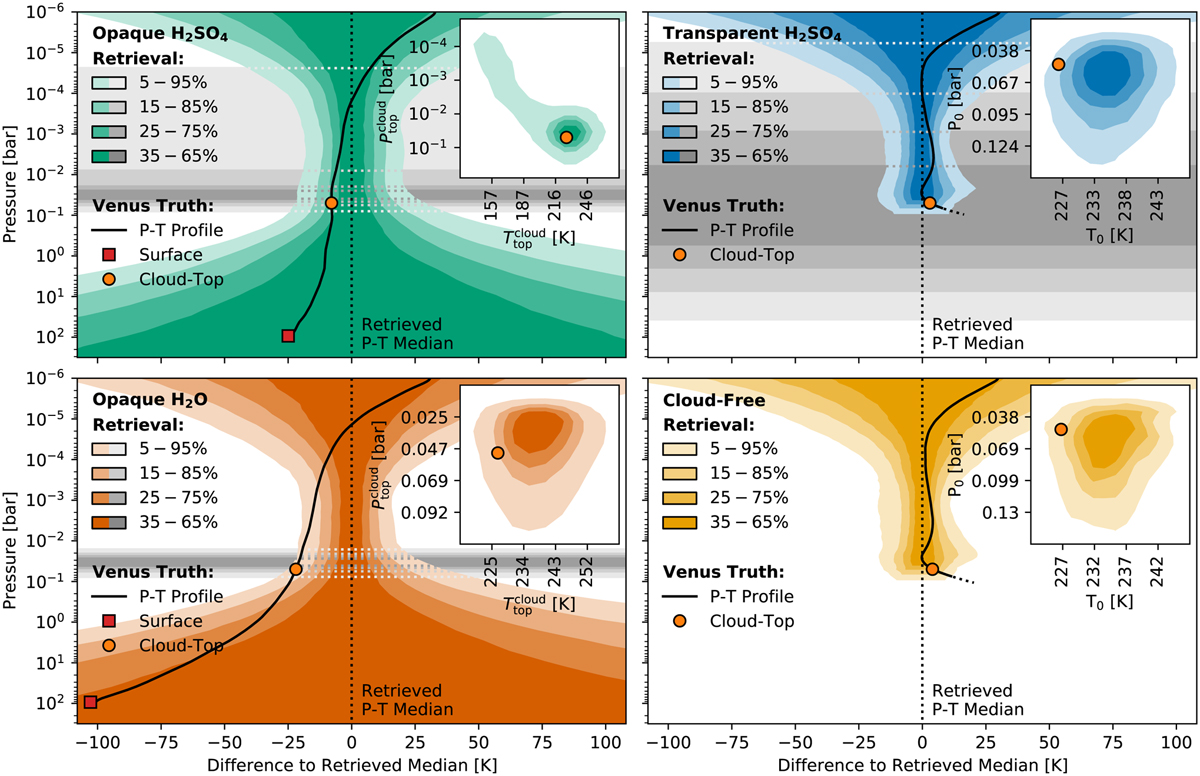
Residuals of the P–T profiles retrieved for the 4 – 18.5 µm, R = 50, LIFESIM S/N = 10 Venus-twin spectrum (opaque H2SO4 clouds) relative to the retrieved median P–T profile. Color-shaded areas indicate percentiles of the P–T residuals. If the model includes clouds, the gray shaded regions indicate percentiles of the retrieved cloud-top pressure. The solid black line, the orange circular marker, and the red square marker represent the true profile relative to the retrieved median (for the transparent H2SO4 cloud and cloud-free models, we cannot plot the true surface and the P–T profile at pressures higher than retrieved surface pressure). In the top right, we plot the 2D P0-T0 posterior (if retrieved; otherwise ![]() . Each panel summarizes the result for one of the four different forward models (see Sect. 2.3.2). From top-left to bottom-right: Opaque H2SO4 clouds, transparent H2SO4 clouds, opaque H2O clouds, and cloud-free.
. Each panel summarizes the result for one of the four different forward models (see Sect. 2.3.2). From top-left to bottom-right: Opaque H2SO4 clouds, transparent H2SO4 clouds, opaque H2O clouds, and cloud-free.
Current usage metrics show cumulative count of Article Views (full-text article views including HTML views, PDF and ePub downloads, according to the available data) and Abstracts Views on Vision4Press platform.
Data correspond to usage on the plateform after 2015. The current usage metrics is available 48-96 hours after online publication and is updated daily on week days.
Initial download of the metrics may take a while.