Fig. 2
Download original image
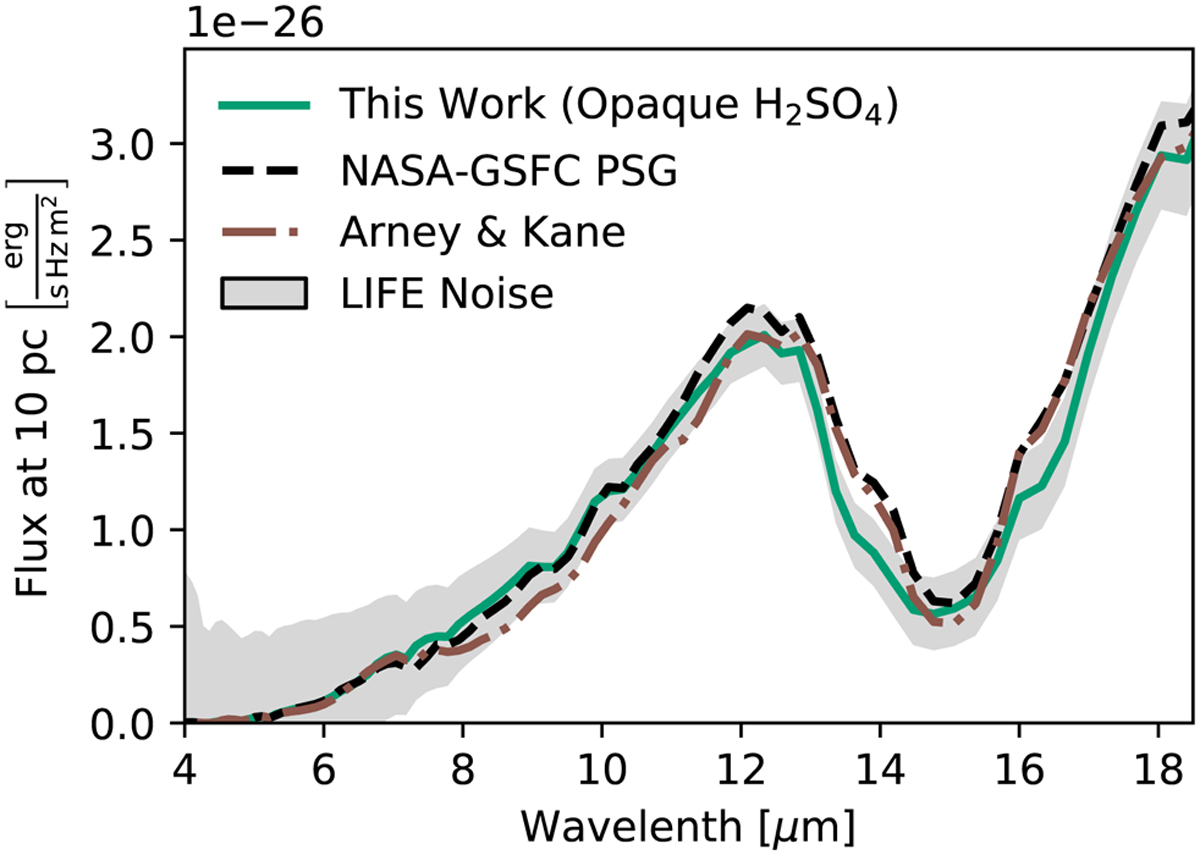
Comparison of our Venus-twin MIR spectrum (opaque H2SO4 clouds) to other models. We show the flux received by an observer located 10 pc from the planet. The solid line is the MIR thermal emission spectrum of our model (calculated assuming the true values listed in Table 1). The gray-shaded region indicates the S/N = 10 LIFESIM uncertainty considered for our retrievals (see Sect. 2.3.1). The black-dashed line is the standard Venus emission spectrum from the NASA-GSFC Planetary Spectrum Generator (PSG, https://psg. gsfc.nasa.gov; Villanueva et al. 2018). The brown-dashed-dotted line is the MIR Venus spectrum from Arney & Kane (2018).
Current usage metrics show cumulative count of Article Views (full-text article views including HTML views, PDF and ePub downloads, according to the available data) and Abstracts Views on Vision4Press platform.
Data correspond to usage on the plateform after 2015. The current usage metrics is available 48-96 hours after online publication and is updated daily on week days.
Initial download of the metrics may take a while.