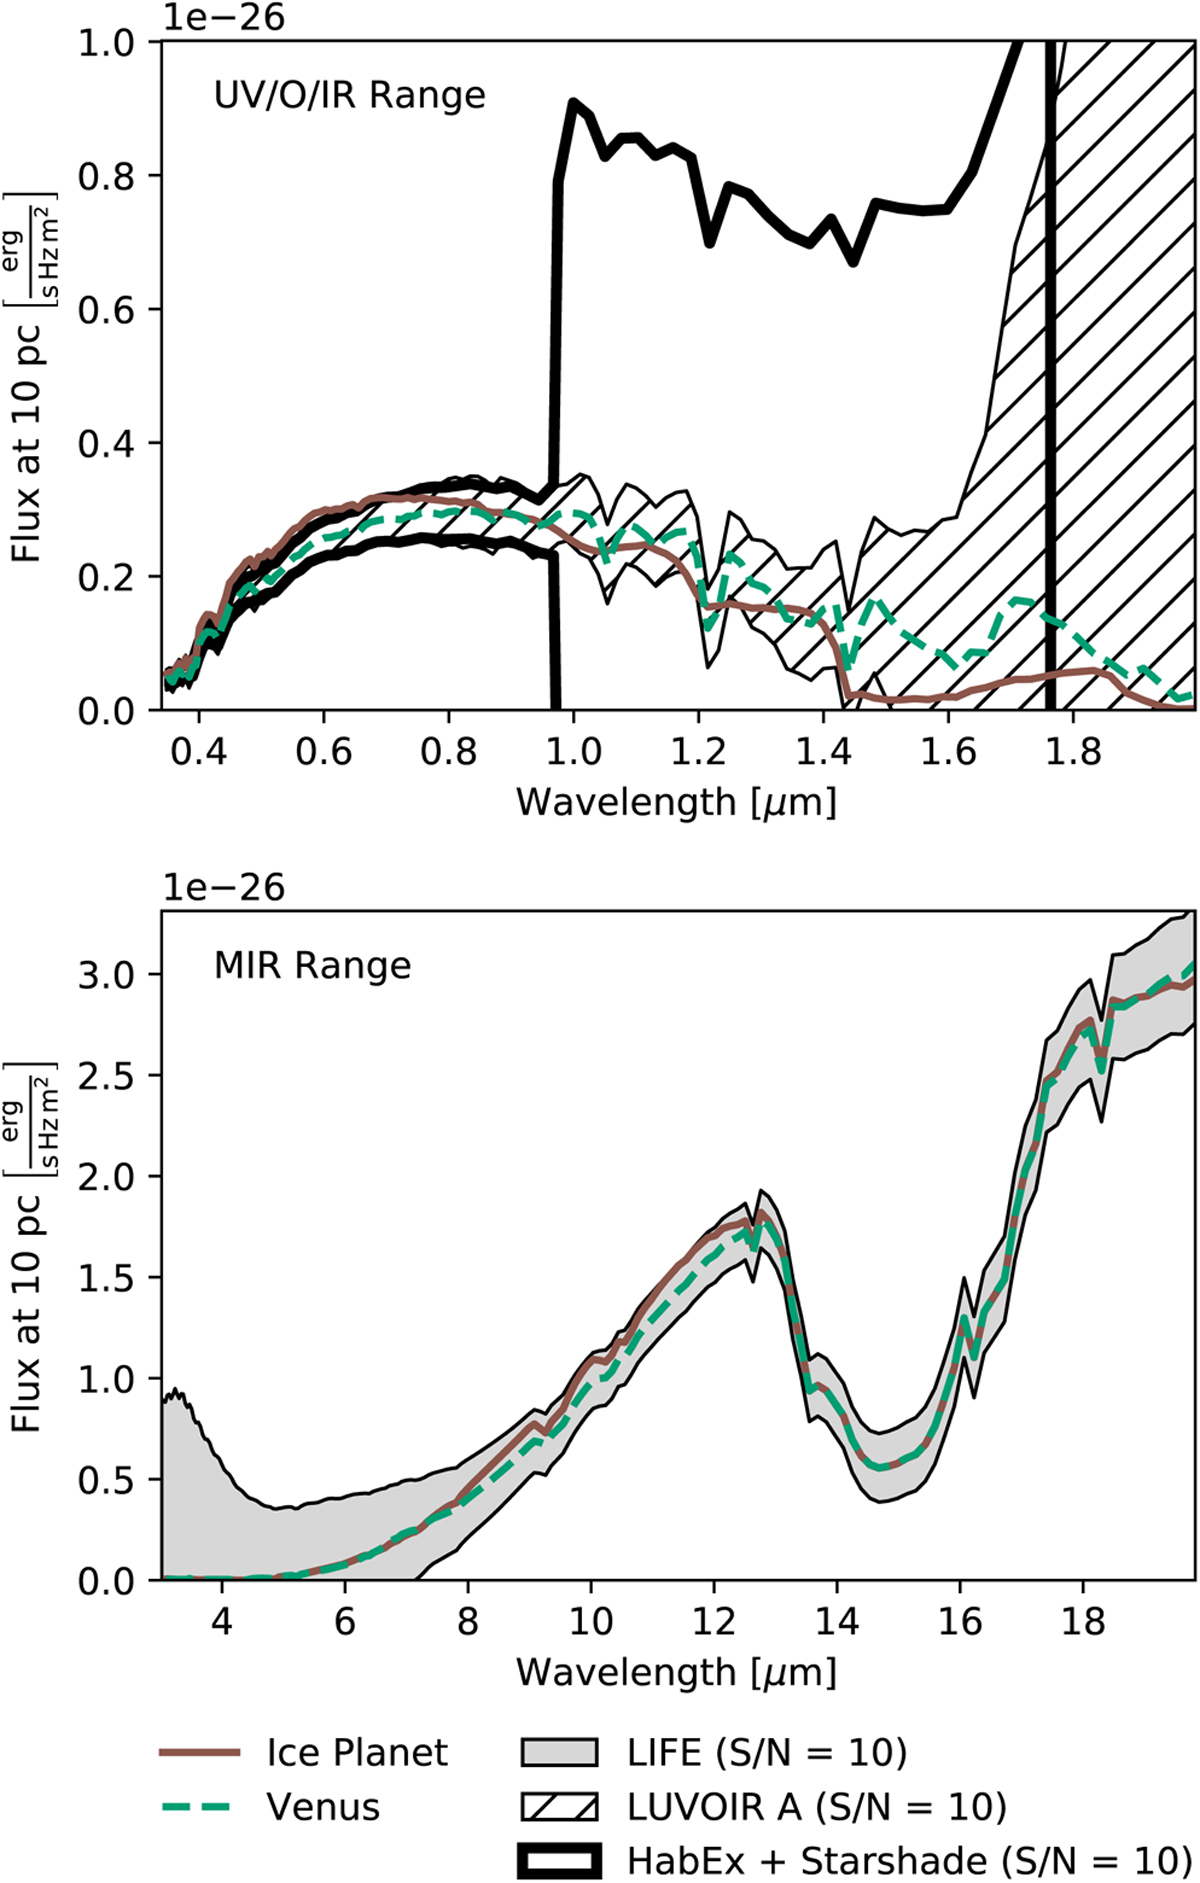
Fig. E.1
Download original image
Flux of a cloudy Venus-twin exoplanet (opaque H2SO4 clouds; dashed green line) compared to an icy world with a thin CO2-dominated atmosphere (solid brown line). In the top panel, we plot the UV/O/NIR wavelength range. The hatched area represents the expected wavelength-dependent S /N = 10 noise for the LUVOIR A mission concept (The LUVOIR Team 2019). The thick, solid black line represents the expected S/N = 10 noise for the HabEx + Starshade mission concept (Gaudi et al. 2020). In the bottom panel, we plot the MIR wavelength range. The gray shaded region indicates the 1σ LIFESIM noise level at S/N = 10.
Current usage metrics show cumulative count of Article Views (full-text article views including HTML views, PDF and ePub downloads, according to the available data) and Abstracts Views on Vision4Press platform.
Data correspond to usage on the plateform after 2015. The current usage metrics is available 48-96 hours after online publication and is updated daily on week days.
Initial download of the metrics may take a while.