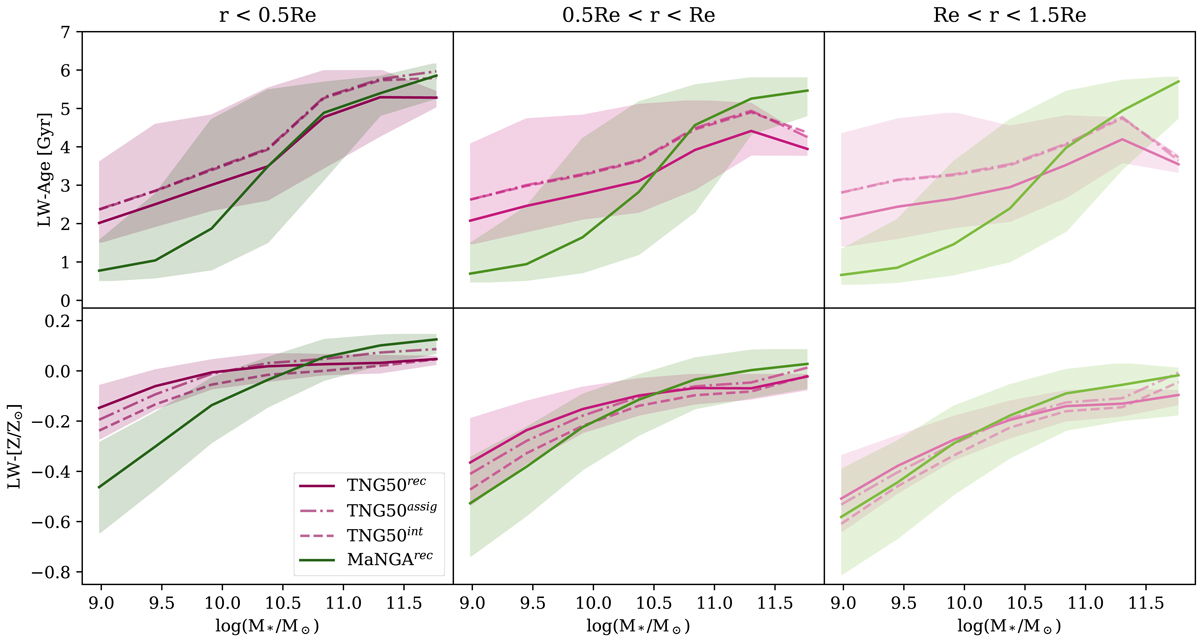
Fig. 11.
Download original image
Median luminosity-weighted age (top panels) and metallicity (bottom panels) per mass bin at increasing radii for MaNGA galaxies (green) and TNG50 fully mocked with PYPIPE3D (solid magenta line). The median values for the TNG50 intrinsic and assigned maps are shown with dashed and dot-dashed lines to compare the median shift produced by the mocking process. The shaded areas span from the 20th to the 80th percentile.
Current usage metrics show cumulative count of Article Views (full-text article views including HTML views, PDF and ePub downloads, according to the available data) and Abstracts Views on Vision4Press platform.
Data correspond to usage on the plateform after 2015. The current usage metrics is available 48-96 hours after online publication and is updated daily on week days.
Initial download of the metrics may take a while.