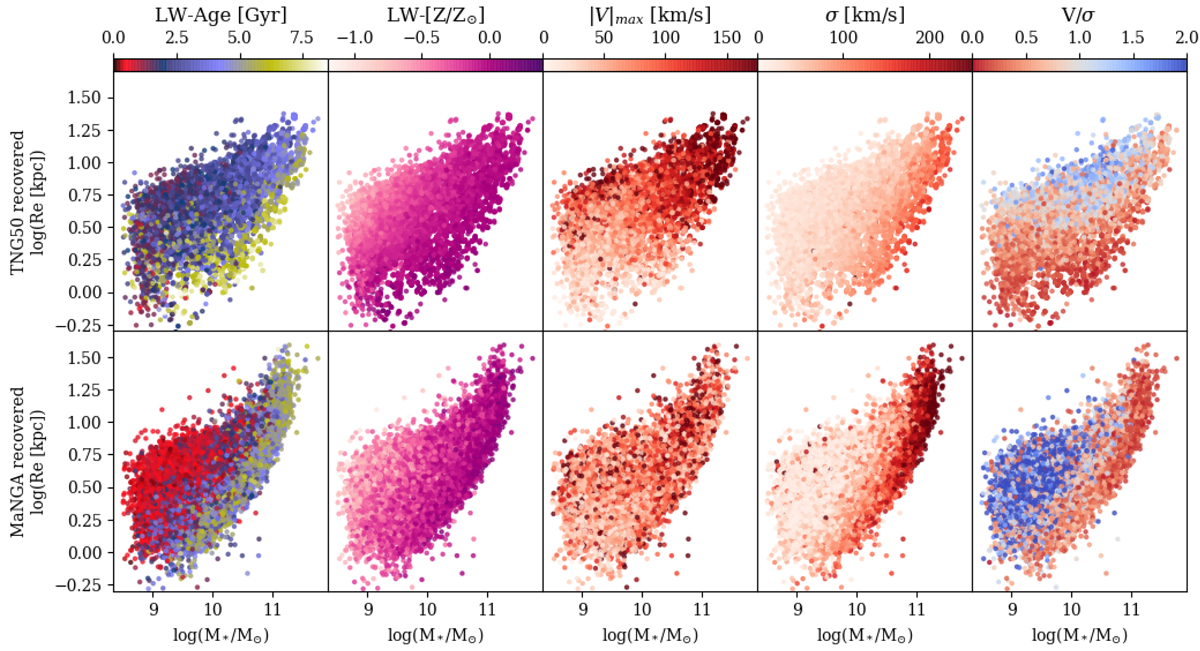
Fig. 10.
Download original image
TNG50 galaxies in the M* − Re plane (top) and their MaNGA counterparts (bottom). The galaxies are colour-coded from left to right by their mean LW-age, LW-metallicity, LOS maximum velocity, dispersion, and projected V/σ calculated within 1 Re from the recovered maps. The trends seen in the observed sample are replicated in the simulated sample with a greater dependence with galaxy size rather than mass. Although there is a discrepancy between the maximum values in dispersion and minimum values in age, the galaxies with these values lie in analogous regions of the plane.
Current usage metrics show cumulative count of Article Views (full-text article views including HTML views, PDF and ePub downloads, according to the available data) and Abstracts Views on Vision4Press platform.
Data correspond to usage on the plateform after 2015. The current usage metrics is available 48-96 hours after online publication and is updated daily on week days.
Initial download of the metrics may take a while.