Open Access
Fig. 3.
Download original image
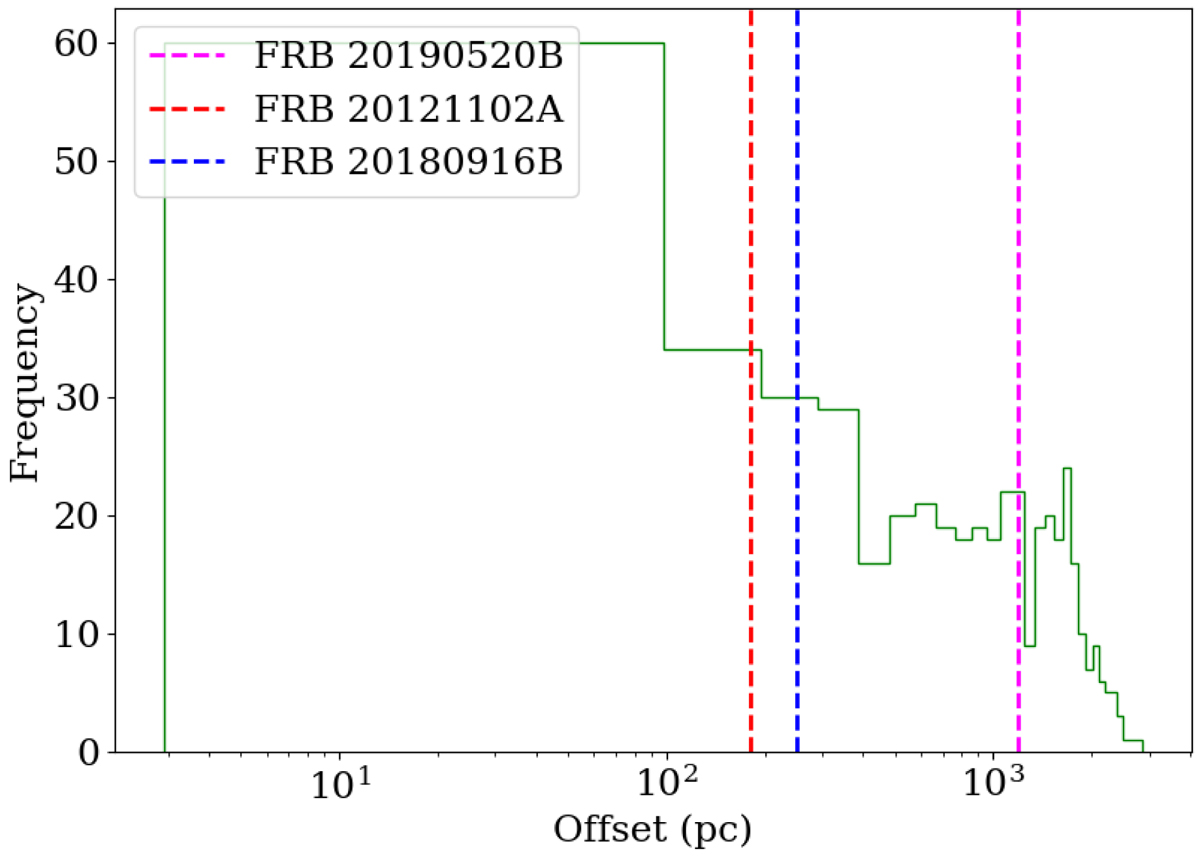
Histogram of projected offset distribution for the simulations of NMB-FRBs as described in Sect. 4.1. The vertical lines show the offsets measured for the three well-localised repeating FRBs, indicating that they are consistent with the expected distribution in an NMB scenario.
Current usage metrics show cumulative count of Article Views (full-text article views including HTML views, PDF and ePub downloads, according to the available data) and Abstracts Views on Vision4Press platform.
Data correspond to usage on the plateform after 2015. The current usage metrics is available 48-96 hours after online publication and is updated daily on week days.
Initial download of the metrics may take a while.