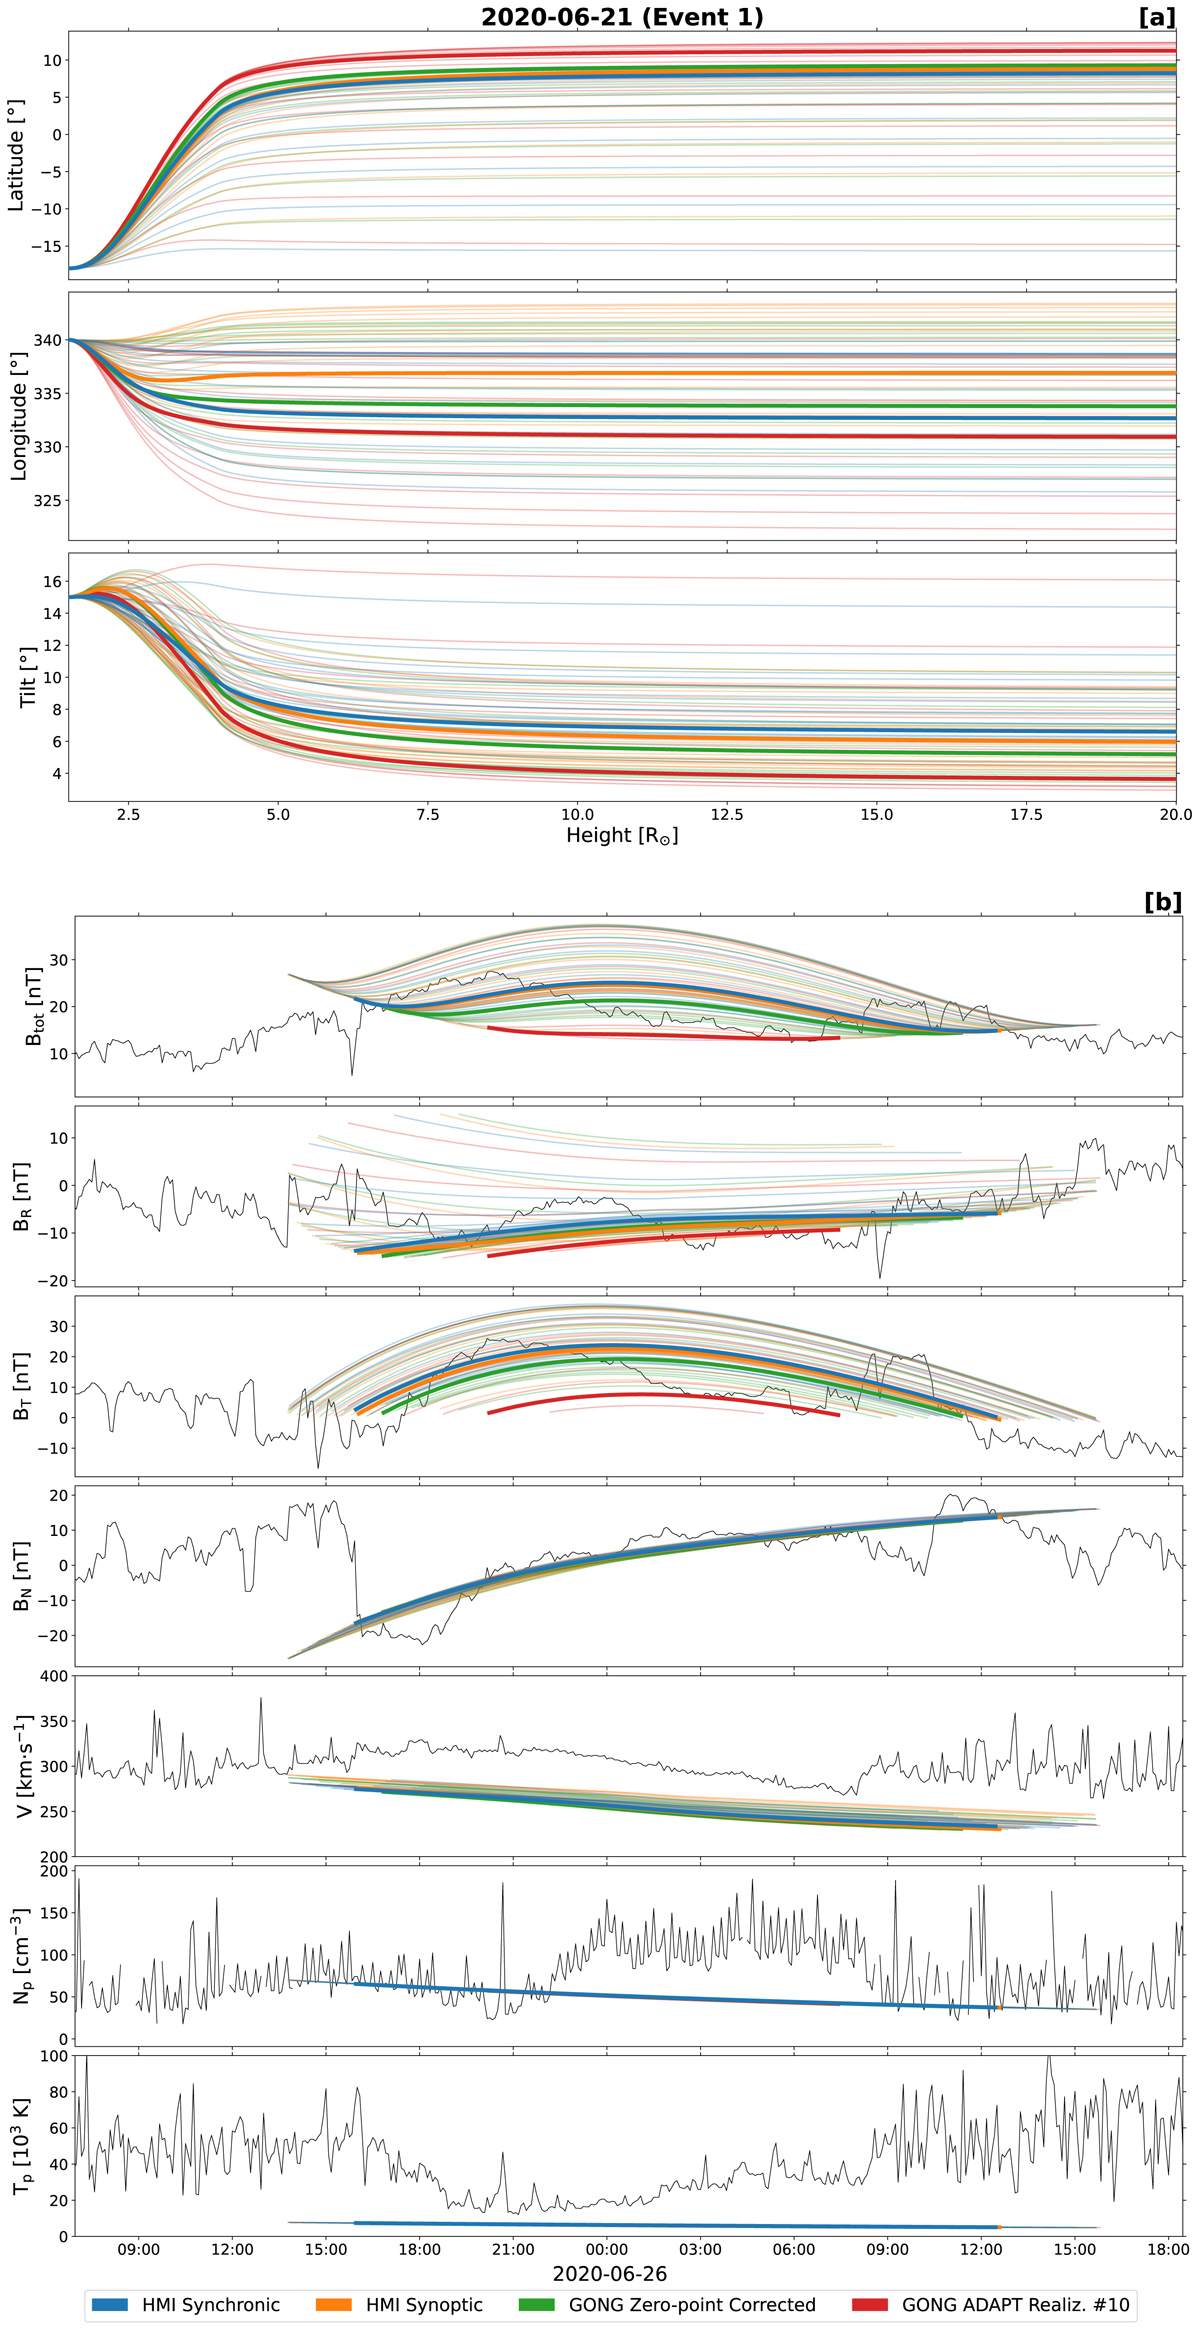
Fig. 6.
Download original image
ForeCAT and FIDO results for Event 1 plotted in panels a and b, respectively. The FIDO results are shown against PSP magnetic field and plasma data. The thicker contours represent the model output using a PFSS with Rss = 2.5 R⊙. The thinner contours represent all other PFSS source surface heights. The four different colors correspond to different input magnetograms. If a given combination of input magnetogram and PFSS source surface height resulted in a “miss” according to OSPREI, it was not included in the FIDO plot (see text for details).
Current usage metrics show cumulative count of Article Views (full-text article views including HTML views, PDF and ePub downloads, according to the available data) and Abstracts Views on Vision4Press platform.
Data correspond to usage on the plateform after 2015. The current usage metrics is available 48-96 hours after online publication and is updated daily on week days.
Initial download of the metrics may take a while.