Fig. 5.
Download original image
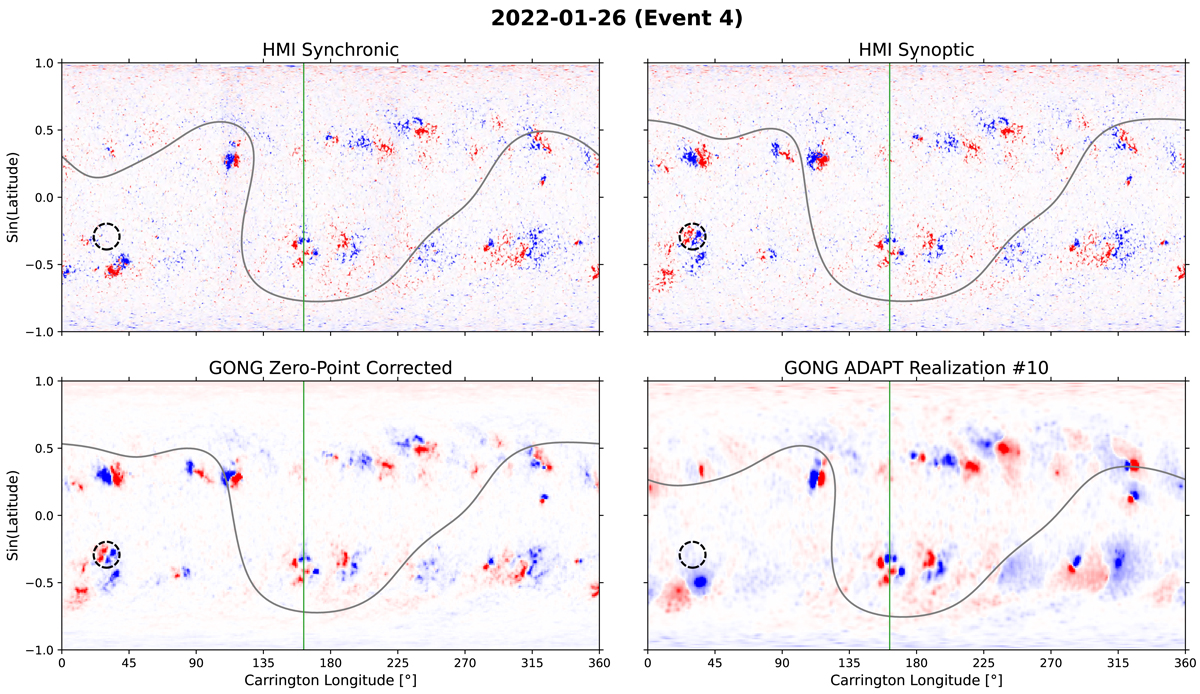
Four magnetograms that we use as input photospheric conditions for Event 4. Top left: HMI Synchronic; Top right: HMI Synoptic; Bottom left: GONG Zero-point corrected; Bottom right: GONG ADAPT Realization #10. The green vertical line indicates the Carrington longitude of the central meridian as seen from Earth. The dotted circle marks the approximate location of the CME source region. The gray curve marks the location of the heliospheric current sheet at 2.5 R⊙. All maps are saturated to ±100 G, with red (blue) indicating positive (negative) polarity.
Current usage metrics show cumulative count of Article Views (full-text article views including HTML views, PDF and ePub downloads, according to the available data) and Abstracts Views on Vision4Press platform.
Data correspond to usage on the plateform after 2015. The current usage metrics is available 48-96 hours after online publication and is updated daily on week days.
Initial download of the metrics may take a while.