Fig. 8.
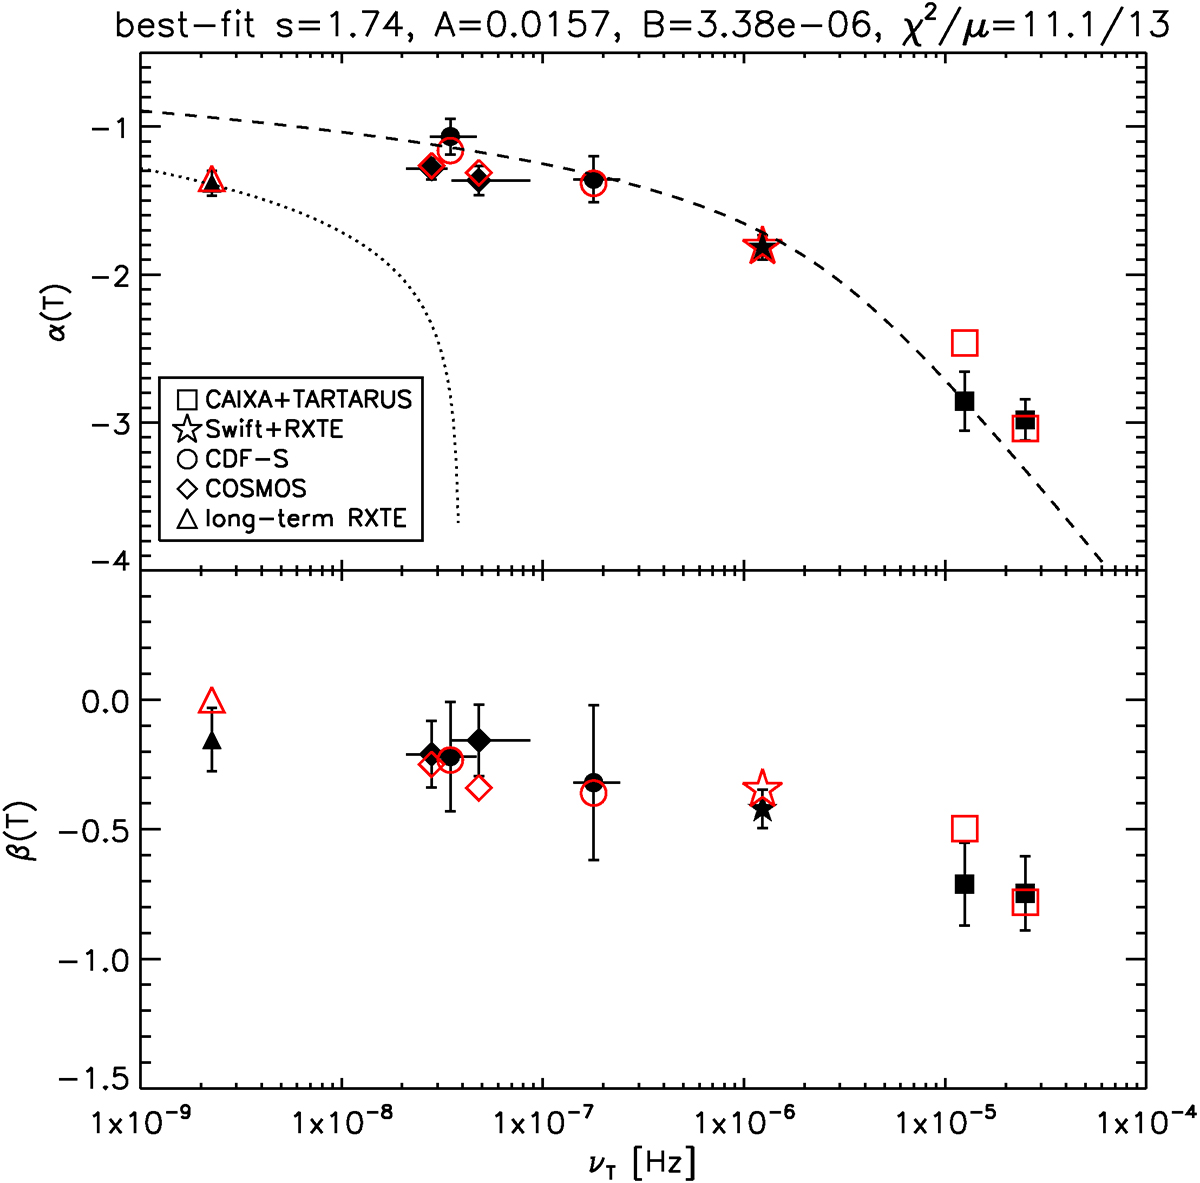
Download original image
Variance– and slope–frequency plots of our AGN sample. Upper panel: observed VFP of a 108 M⊙ AGN as a function of the rest-frame frequency νT using our measurements from Table 1 (filled symbols). The red empty symbols indicate the best-fit model values (α(Tmax) in Eq. (4)). For reference, we also show the theoretically expected trends for a 108 M⊙ BH monitored with an average Δtmin = 250 s (dashed line) and Δtmin = 300 days (dotted line), but we stress that the comparison should be made between the filled and empty points. Lower panel: measured and best-fit model slope of the ![]() –MBH relations (β(Tmax) in Eq. (4)); symbols have the same meaning as those in the upper panel.
–MBH relations (β(Tmax) in Eq. (4)); symbols have the same meaning as those in the upper panel.
Current usage metrics show cumulative count of Article Views (full-text article views including HTML views, PDF and ePub downloads, according to the available data) and Abstracts Views on Vision4Press platform.
Data correspond to usage on the plateform after 2015. The current usage metrics is available 48-96 hours after online publication and is updated daily on week days.
Initial download of the metrics may take a while.