Fig. 3.
Download original image
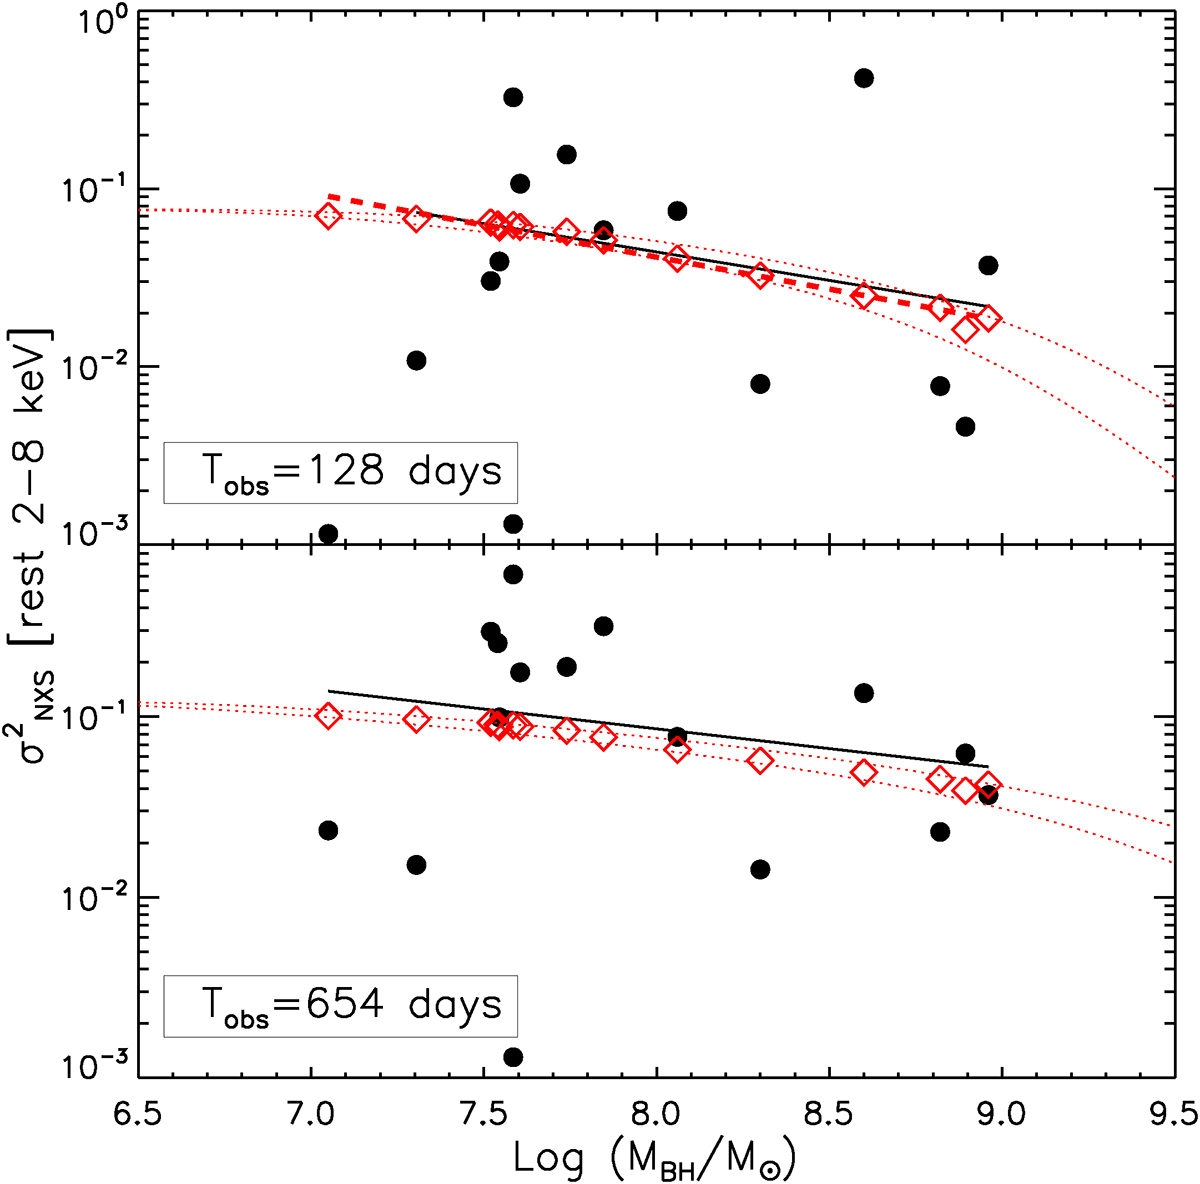
![]() vs. MBH for the CDF-S ‘robust’ sample (filled circles) for the two different timescales discussed in the text. The solid lines show the linear fit to the data. Open diamonds show the best-fit model-predicted variance computed by taking into account the rest-frame Trest, and Δtmin, rest of each source. The dashed lines mark the best fit to the model predictions (see Sect. 6 for details). The dotted curves represent the model trends for the sources at z = 0.5 (top one) and z = 2.0 (bottom one), which is the approximate redshift range of the CDF-S sample (see Fig. 2).
vs. MBH for the CDF-S ‘robust’ sample (filled circles) for the two different timescales discussed in the text. The solid lines show the linear fit to the data. Open diamonds show the best-fit model-predicted variance computed by taking into account the rest-frame Trest, and Δtmin, rest of each source. The dashed lines mark the best fit to the model predictions (see Sect. 6 for details). The dotted curves represent the model trends for the sources at z = 0.5 (top one) and z = 2.0 (bottom one), which is the approximate redshift range of the CDF-S sample (see Fig. 2).
Current usage metrics show cumulative count of Article Views (full-text article views including HTML views, PDF and ePub downloads, according to the available data) and Abstracts Views on Vision4Press platform.
Data correspond to usage on the plateform after 2015. The current usage metrics is available 48-96 hours after online publication and is updated daily on week days.
Initial download of the metrics may take a while.