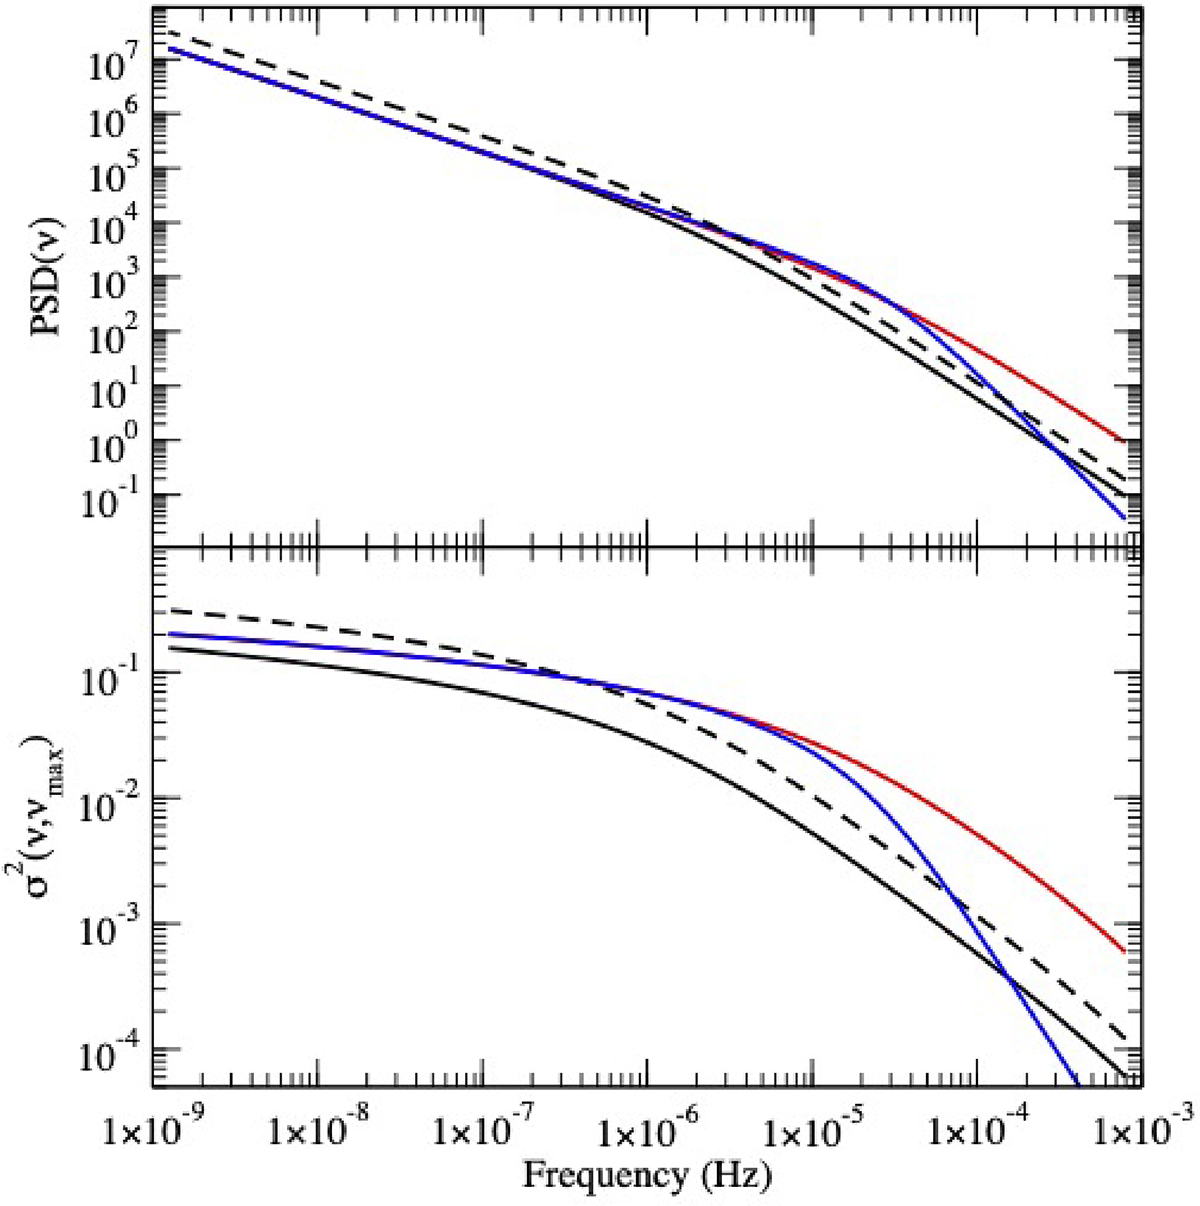
Fig. 1.
Download original image
PSD and VFP (upper and lower panels, respectively) of an AGN with a BH mass of 108 M⊙. The PSD model parameters are: A = 0.02 Hz−1, s = 1, and νb = 3 ⋅ 10−6 Hz (black solid lines). Black dashed lines indicate the PSD and VFP when we increase the PSD amplitude by a factor of 2. Red lines show the PSD and VFP when we increase the bend frequency (by a factor of 10), while the blue lines show the changes when we increase the high-frequency PSD slope from −2 to −3 (all the other parameters in this case are like those of the red lines). For the computation of the variance, we assumed νmax = (1/250 s).
Current usage metrics show cumulative count of Article Views (full-text article views including HTML views, PDF and ePub downloads, according to the available data) and Abstracts Views on Vision4Press platform.
Data correspond to usage on the plateform after 2015. The current usage metrics is available 48-96 hours after online publication and is updated daily on week days.
Initial download of the metrics may take a while.