Fig. 7
Download original image
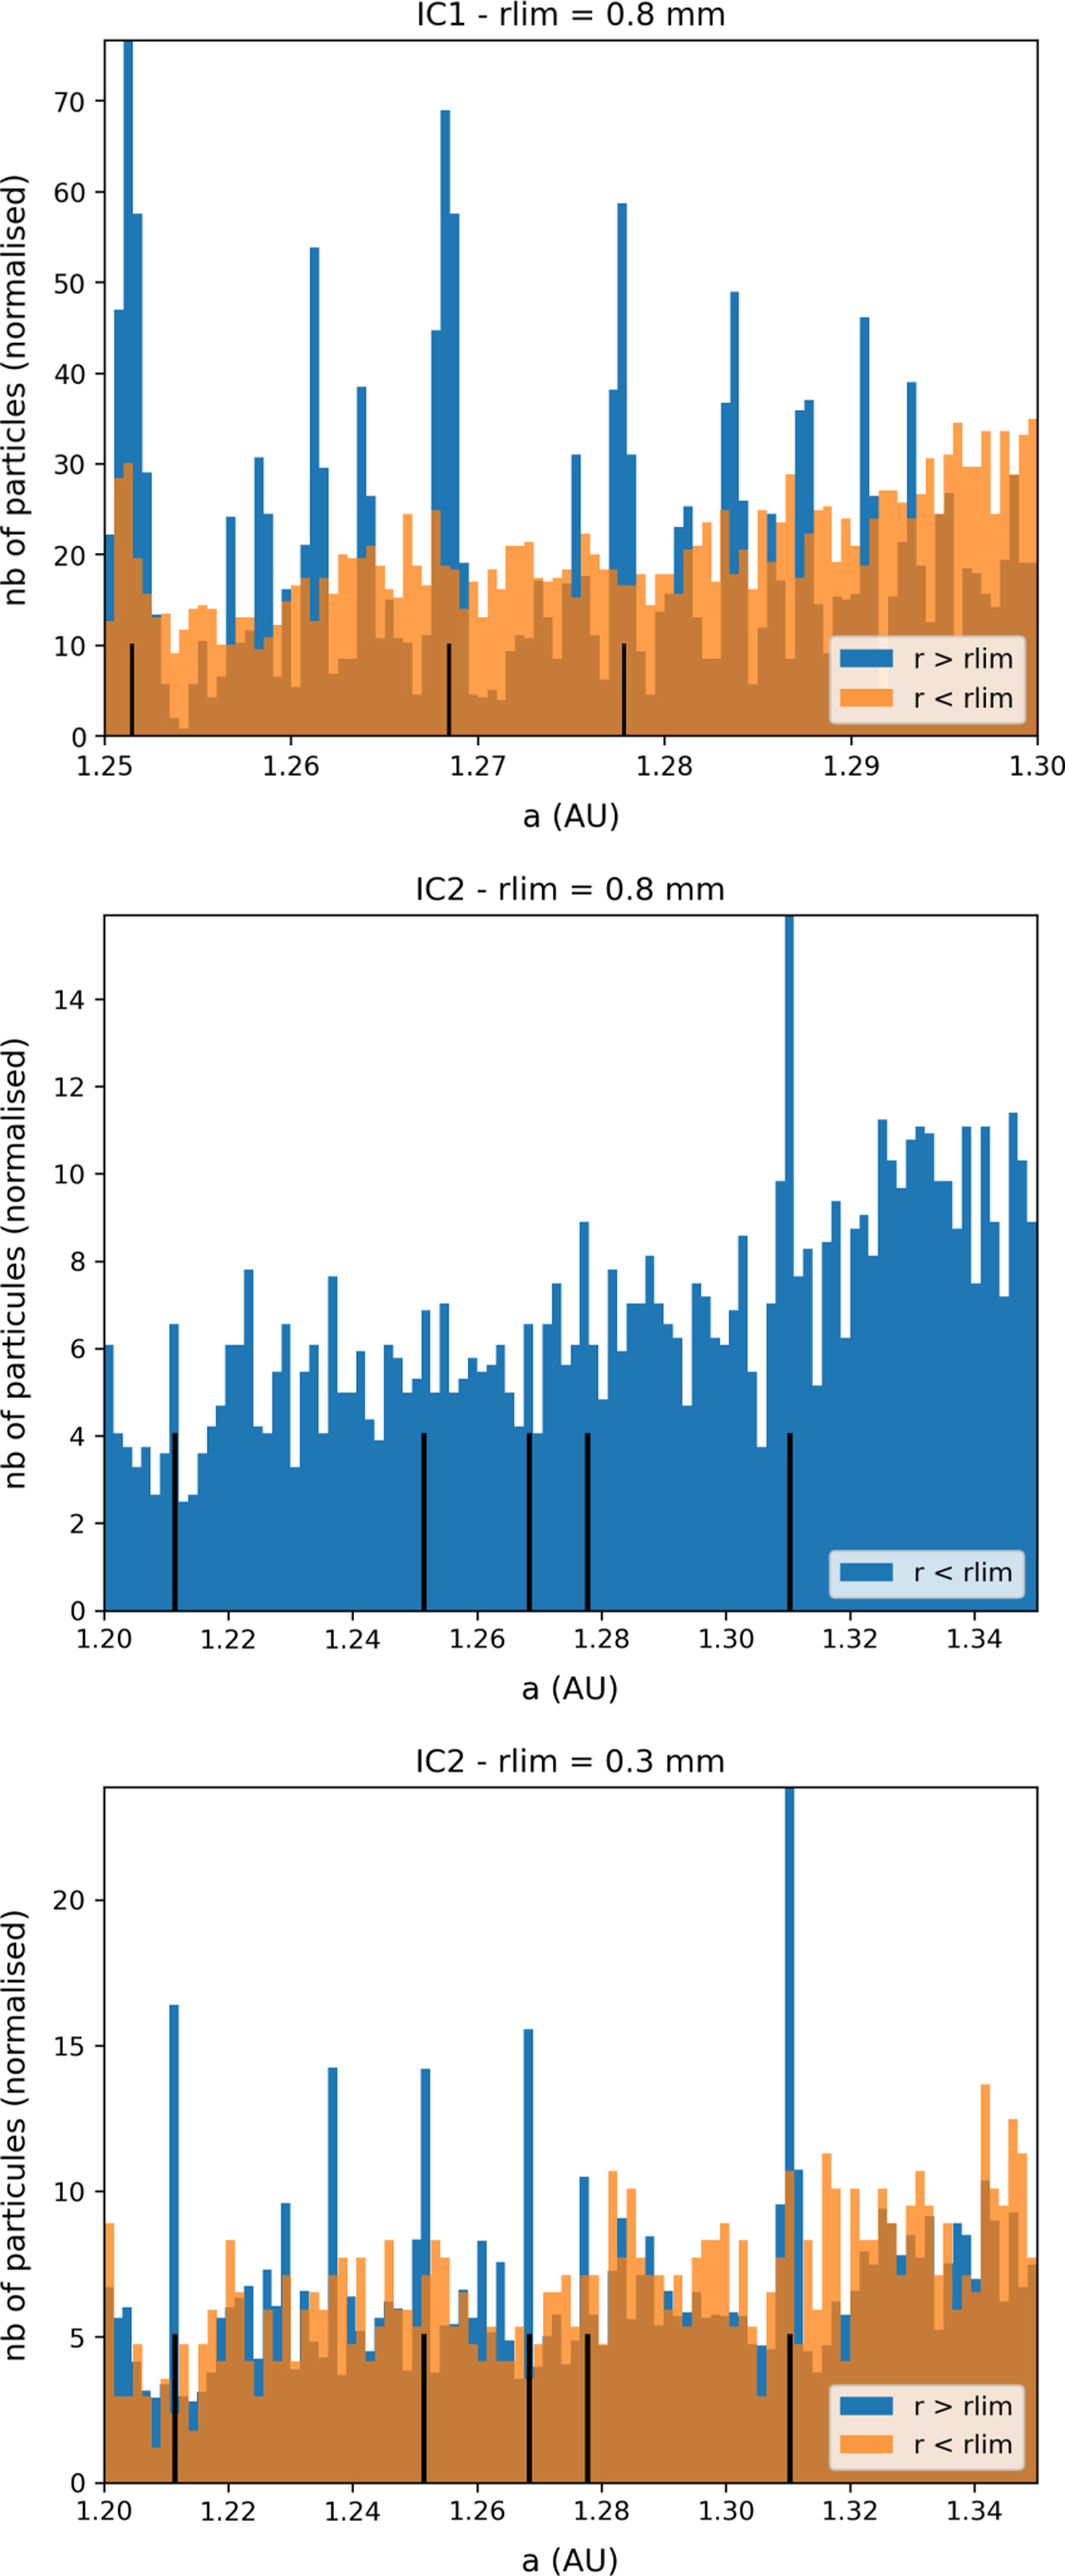
Histograms for the search in radius limit. On each graph, black lines mark the MMRs. The histogram titled ‘IC1 − rlim = 0.8 mm’ counts particles from IC1 and compares those whose radius is inferior to rlim with those whose radius is superior to rlim. The second histogram counts particles from IC2 with a radius inferior to rlim. The last histogram also counts particles from IC2 but changes the value of the radius limit to rlim = 3 × 10⁻⁴ m and compares particles whose radius is lower than or superior to rlim.
Current usage metrics show cumulative count of Article Views (full-text article views including HTML views, PDF and ePub downloads, according to the available data) and Abstracts Views on Vision4Press platform.
Data correspond to usage on the plateform after 2015. The current usage metrics is available 48-96 hours after online publication and is updated daily on week days.
Initial download of the metrics may take a while.