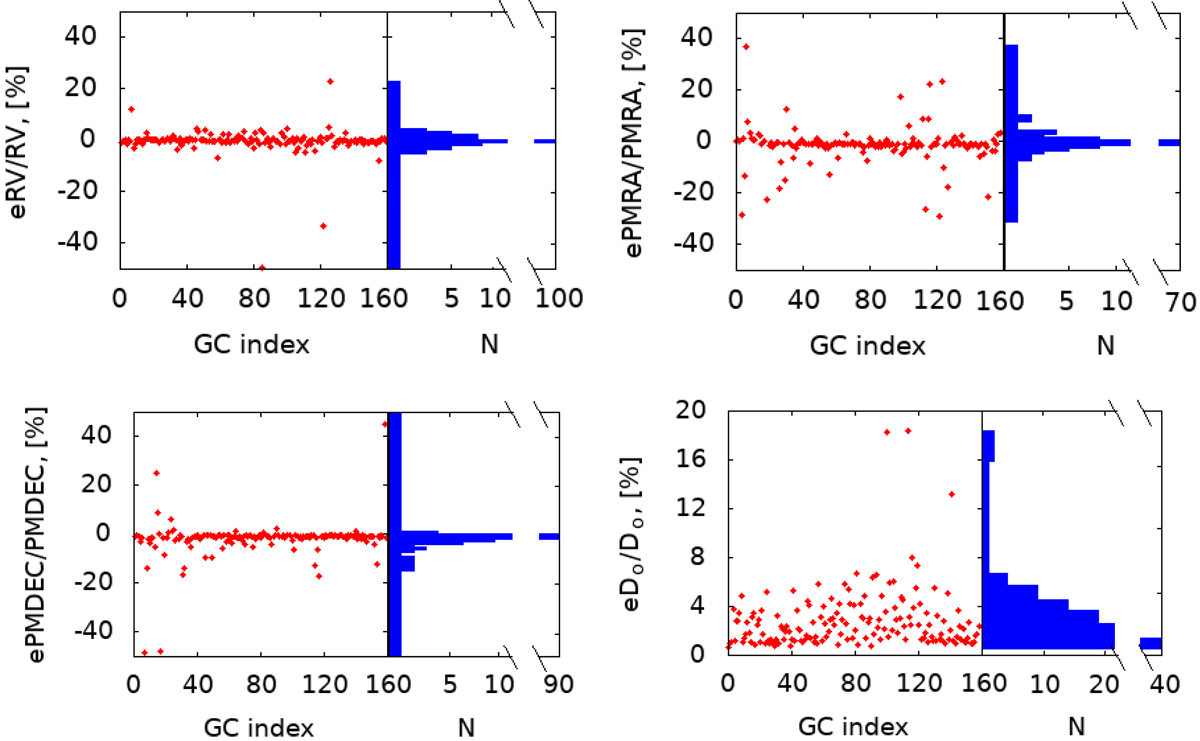
Fig. 1.
Download original image
Distribution of the relative errors (from left to right): radial velocity (eRV), proper motions in right ascension (ePMRA), and declination (ePMDEC), and in heliocentric distance eD⊙. Blue histograms represent the error distributions. The following GCs are not shown because the error values are too high: Crater, Lae 3, NGC 6760, BH 261, NGC 6553, and Pal 13, except in the graph in the bottom right panel.
Current usage metrics show cumulative count of Article Views (full-text article views including HTML views, PDF and ePub downloads, according to the available data) and Abstracts Views on Vision4Press platform.
Data correspond to usage on the plateform after 2015. The current usage metrics is available 48-96 hours after online publication and is updated daily on week days.
Initial download of the metrics may take a while.