Fig. 8.
Download original image
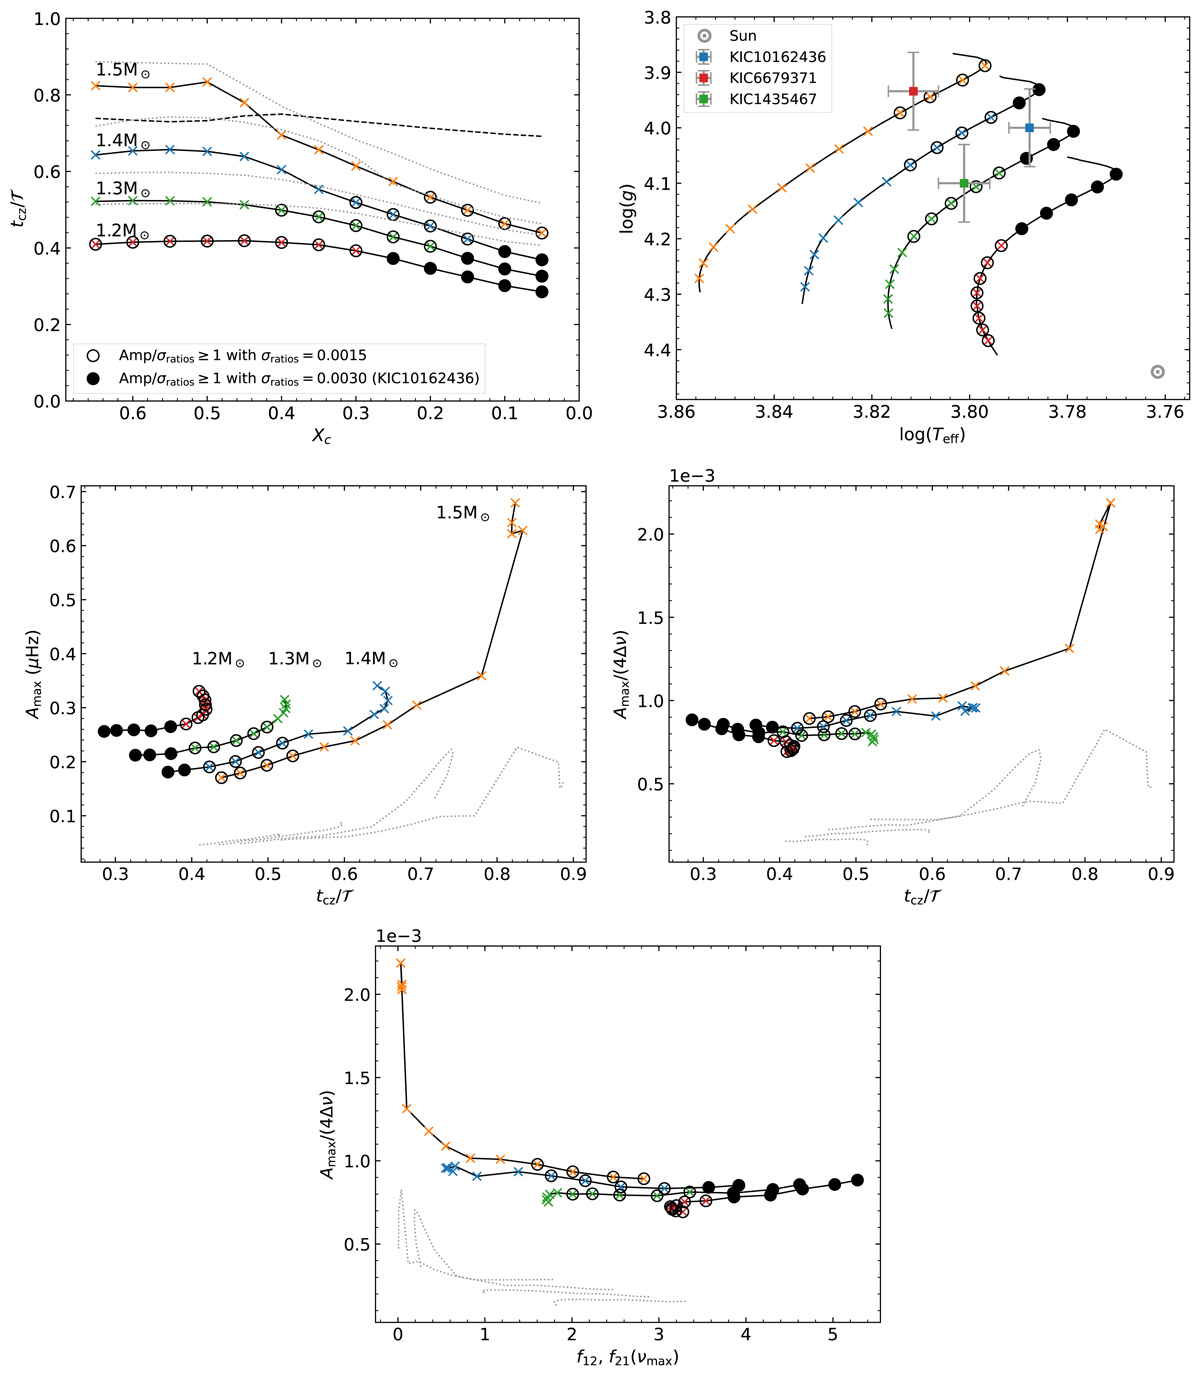
Detectability of the signature in the r010 ratios for different quantities. The open and black circles show that the signature of the BSCZ glitch has an amplitude, ![]() , that is larger than 0.0015 and 0.0030 (the mean uncertainty of the r010 ratios of 16 Cyg A and KIC 10162436 around νmax), respectively. Top left: ratio of the acoustic radius of the BSCZ (tcz) over the total acoustic radius (𝒯) for models with masses between 1.2 and 1.5 M⊙ and ξPC = 2. The dashed line represents the position of the iron/nickel convective zone induced by their accumulations due to radiative accelerations for a 1.5 M⊙ model. Top right: associated evolutionary tracks in a Kiel diagram. Middle left: amplitudes Amax according to the ratio of the acoustic radius of the BSCZ (tcz) over the total acoustic radius (𝒯) for the same models. Middle right: amplitudes Amax/(4Δν) according to the ratio of the acoustic radius of the BSCZ (tcz) over the total acoustic radius (𝒯) for the same models. Bottom: amplitudes Amax/(4Δν) according to f12, 21 at
, that is larger than 0.0015 and 0.0030 (the mean uncertainty of the r010 ratios of 16 Cyg A and KIC 10162436 around νmax), respectively. Top left: ratio of the acoustic radius of the BSCZ (tcz) over the total acoustic radius (𝒯) for models with masses between 1.2 and 1.5 M⊙ and ξPC = 2. The dashed line represents the position of the iron/nickel convective zone induced by their accumulations due to radiative accelerations for a 1.5 M⊙ model. Top right: associated evolutionary tracks in a Kiel diagram. Middle left: amplitudes Amax according to the ratio of the acoustic radius of the BSCZ (tcz) over the total acoustic radius (𝒯) for the same models. Middle right: amplitudes Amax/(4Δν) according to the ratio of the acoustic radius of the BSCZ (tcz) over the total acoustic radius (𝒯) for the same models. Bottom: amplitudes Amax/(4Δν) according to f12, 21 at ![]() . For the top left, middle and bottom panels, the dotted grey lines represent the same models with ξPC = 0.
. For the top left, middle and bottom panels, the dotted grey lines represent the same models with ξPC = 0.
Current usage metrics show cumulative count of Article Views (full-text article views including HTML views, PDF and ePub downloads, according to the available data) and Abstracts Views on Vision4Press platform.
Data correspond to usage on the plateform after 2015. The current usage metrics is available 48-96 hours after online publication and is updated daily on week days.
Initial download of the metrics may take a while.