Fig. 5.
Download original image
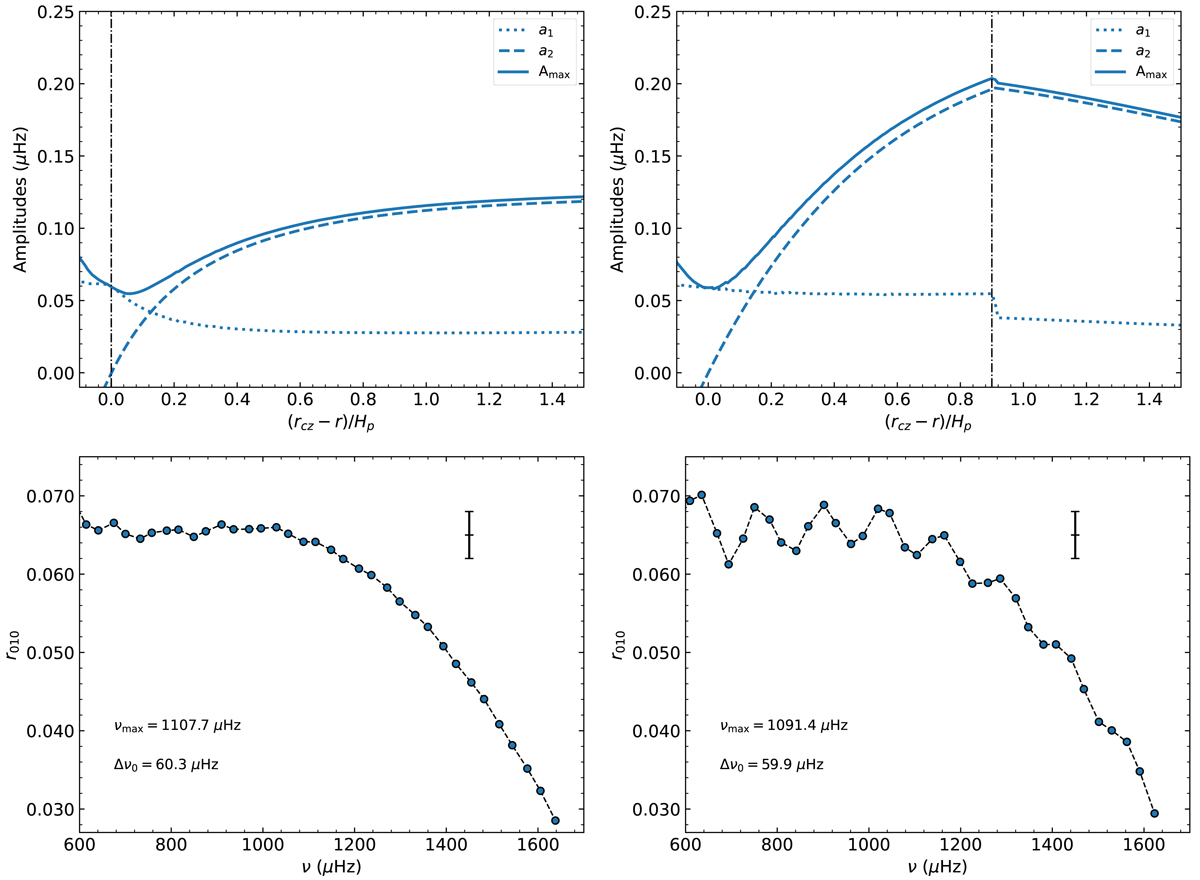
Glitch parameters and signature with and without penetrative convection. Top: amplitudes a1 (dotted lines), a2 (dashed lines), and Amax (solid lines) (Eq. (11), (12), and (15)) as functions of the extent of the PC region in pressure scale height for models B1 (left panel) and B2 (right panel) at Xc = 0.15. The dot-dashed lines represent the BSCZ. Bottom: ratios r010 according to the frequency for the same models. The error bar represents the typical mean uncertainty on the ratios, such as the one obtained for KIC 10162436.
Current usage metrics show cumulative count of Article Views (full-text article views including HTML views, PDF and ePub downloads, according to the available data) and Abstracts Views on Vision4Press platform.
Data correspond to usage on the plateform after 2015. The current usage metrics is available 48-96 hours after online publication and is updated daily on week days.
Initial download of the metrics may take a while.