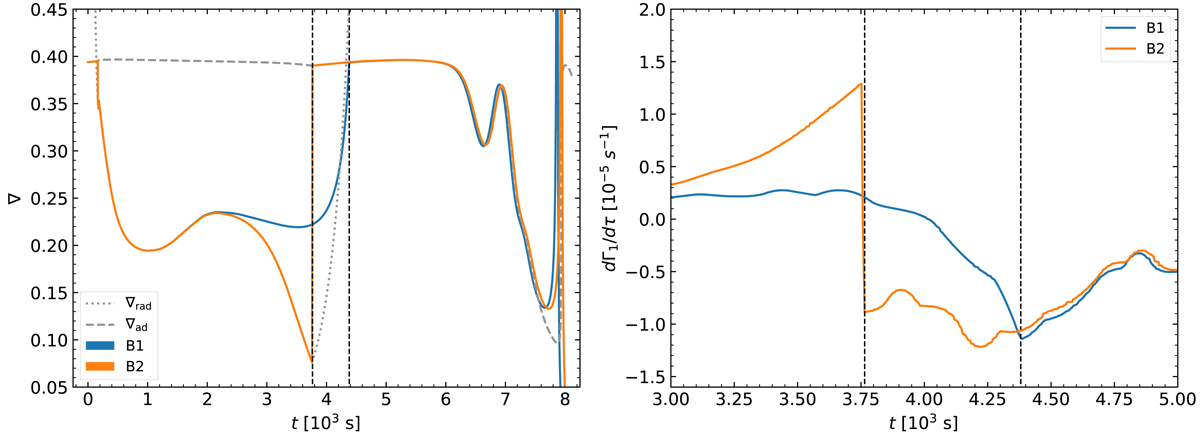
Fig. 3.
Download original image
Internal structure profiles with and without penetrative convection. Left: temperature gradients as function of acoustic radius for the B1 and B2 models with M = 1.4 M⊙ and Xc = 0.15. The grey lines represent the adiabatic and radiative gradients of model B2 (which are very similar to those of B1). The vertical dashed black line on the right represents the position of the Schwarzschild limit for both models. The line on the left represents the bottom of the penetrative convective region of model B2. The downward arrow shows the middle of the acoustic cavity (tcz/𝒯 ≈ 4180 s). Right: dΓ1/dτ as a function of the acoustic radius for models B1 and B2.
Current usage metrics show cumulative count of Article Views (full-text article views including HTML views, PDF and ePub downloads, according to the available data) and Abstracts Views on Vision4Press platform.
Data correspond to usage on the plateform after 2015. The current usage metrics is available 48-96 hours after online publication and is updated daily on week days.
Initial download of the metrics may take a while.