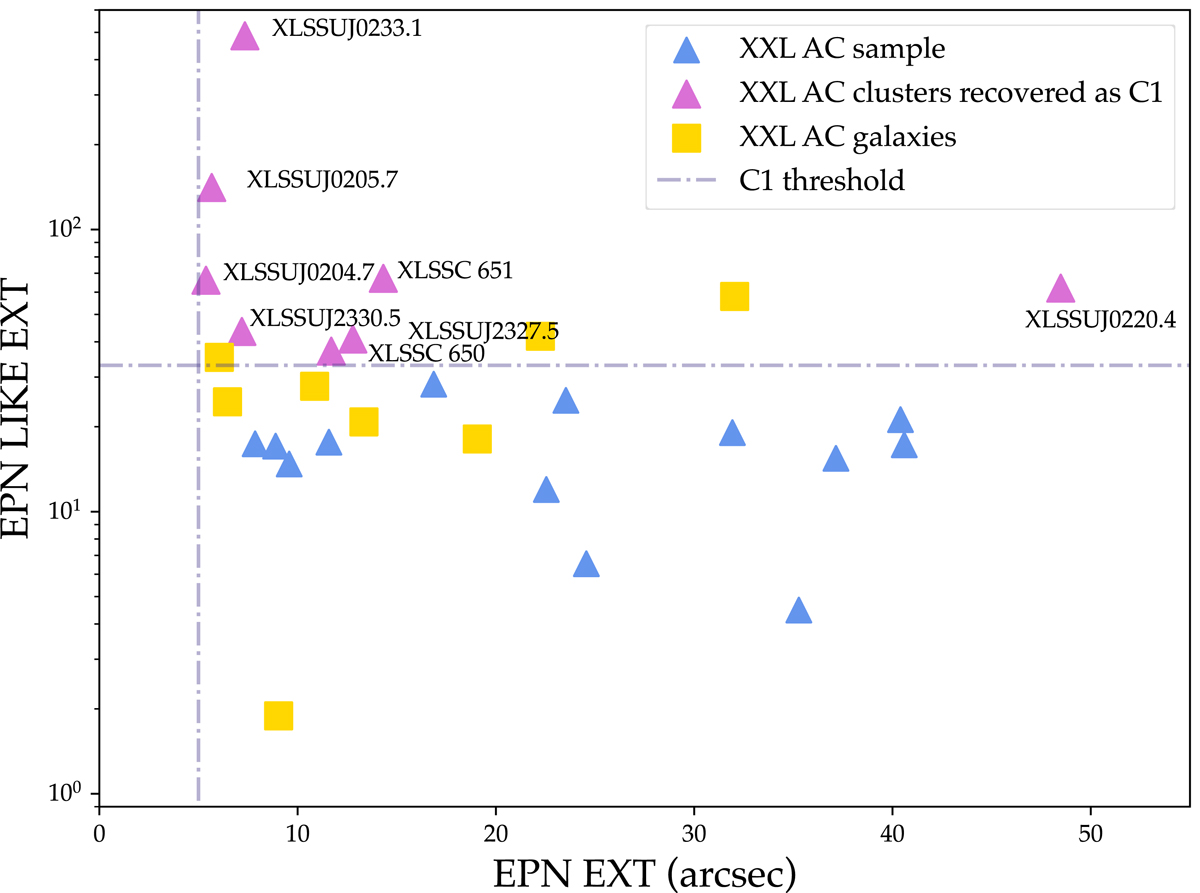
Fig. 8.
Download original image
AC clusters recovered as C1 by detection pipeline after the point-source contribution from the central region of the cluster is removed. The recovered clusters are given by the pink triangles, while the total AC population is displayed in blue. Yellow squares denote AC galaxies that would not appear in the final sample following visual screening. The lilac dot-dashed line demarcates the C1 threshold. We note that four AC clusters do not appear in this plot as their EPN LIKE EXT value is exactly 0, indicating that their profiles were too peaked to be fitted adequately by the extended model.
Current usage metrics show cumulative count of Article Views (full-text article views including HTML views, PDF and ePub downloads, according to the available data) and Abstracts Views on Vision4Press platform.
Data correspond to usage on the plateform after 2015. The current usage metrics is available 48-96 hours after online publication and is updated daily on week days.
Initial download of the metrics may take a while.